Estimated Value: $439,000 - $495,980
4
Beds
3
Baths
2,726
Sq Ft
$176/Sq Ft
Est. Value
About This Home
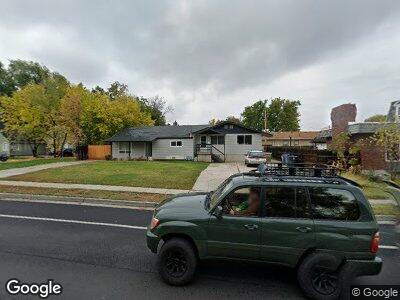
This home is located at 615 36th St, Ogden, UT 84403 and is currently estimated at $478,745, approximately $175 per square foot. 615 36th St is a home located in Weber County with nearby schools including Burch Creek School, South Ogden Junior High School, and Bonneville High School.
Ownership History
Date
Name
Owned For
Owner Type
Purchase Details
Closed on
May 9, 2018
Sold by
Equity Homes Llc
Bought by
Orencole Rebecca D
Current Estimated Value
Home Financials for this Owner
Home Financials are based on the most recent Mortgage that was taken out on this home.
Original Mortgage
$875,000
Outstanding Balance
$762,070
Interest Rate
4.44%
Mortgage Type
Stand Alone Second
Estimated Equity
-$283,325
Purchase Details
Closed on
Nov 13, 2017
Sold by
Equity Homes Llc
Bought by
Affiliated Financial Group Trusts
Purchase Details
Closed on
Sep 28, 2017
Sold by
The Carlyle And Terry Shaw Revocable Liv
Bought by
Equity Homes Llc
Purchase Details
Closed on
Jul 31, 2017
Sold by
Shaw Carlyle and Shaw Terry J
Bought by
Shaw Carlyle and Shaw Terry
Create a Home Valuation Report for This Property
The Home Valuation Report is an in-depth analysis detailing your home's value as well as a comparison with similar homes in the area
Home Values in the Area
Average Home Value in this Area
Purchase History
| Date | Buyer | Sale Price | Title Company |
|---|---|---|---|
| Orencole Rebecca D | -- | Intermountain Title Ins & E | |
| Affiliated Financial Group Trusts | $150,000 | Intermountain Title Ins & Es | |
| Equity Homes Llc | -- | Mountain View Title | |
| Shaw Carlyle | -- | None Available |
Source: Public Records
Mortgage History
| Date | Status | Borrower | Loan Amount |
|---|---|---|---|
| Open | Orencole Rebecca D | $240,419 | |
| Open | Orencole Rebecca D | $875,000 | |
| Closed | Orencole Rebecca D | $245,471 |
Source: Public Records
Tax History Compared to Growth
Tax History
| Year | Tax Paid | Tax Assessment Tax Assessment Total Assessment is a certain percentage of the fair market value that is determined by local assessors to be the total taxable value of land and additions on the property. | Land | Improvement |
|---|---|---|---|---|
| 2024 | $3,343 | $270,049 | $46,750 | $223,299 |
| 2023 | $3,165 | $255,750 | $34,595 | $221,155 |
| 2022 | $3,165 | $264,000 | $23,375 | $240,625 |
| 2021 | $2,408 | $332,001 | $42,500 | $289,501 |
| 2020 | $1,896 | $237,000 | $39,215 | $197,785 |
| 2019 | $1,573 | $181,999 | $30,668 | $151,331 |
| 2018 | $1,595 | $177,000 | $30,668 | $146,332 |
| 2017 | $1,367 | $141,588 | $26,179 | $115,409 |
| 2016 | $1,213 | $68,730 | $14,025 | $54,705 |
| 2015 | $1,236 | $69,047 | $14,025 | $55,022 |
| 2014 | $1,356 | $87,784 | $14,025 | $73,759 |
Source: Public Records
Map
Nearby Homes
- 748 Maple St
- 3555 Adams Ave
- 3677 Adams Ave
- 3535 Adams Ave
- 3523 Adams Ave
- 738 35th St
- 3654 Ogden Ave
- 3374 Porter Ave
- 3700 S Washington Blvd
- 3656 S Monroe Blvd
- 3314 Porter Ave
- 3264 S Quincy Ave
- 3848 Grandview Dr
- 3249 Jefferson Ave
- 314 38th St
- 1616 S Fowler Ave
- 309 34th St
- 1554 S Monroe Blvd Unit F4
- 333 S Monroe Blvd Unit 23
- 3260 Ogden Ave
- 615 36th St
- 625 36th St
- 3602 Jefferson Ave
- 627 36th St
- 3620 Jefferson Ave
- 4010 Adams Ave
- 3621 Orchard Ave Unit Downstairs
- 3621 S Orchard E
- 3621 Orchard Ave
- 604 36th St
- 3615 Orchard Ave
- 3625 Orchard Ave
- 630 36th St
- 3640 Jefferson Ave
- 3582 Jefferson Ave
- 3582 Jefferson Ave
- 3631 Orchard Ave
- 642 36th St
- 3570 Jefferson Ave
- 3601 Jefferson Ave