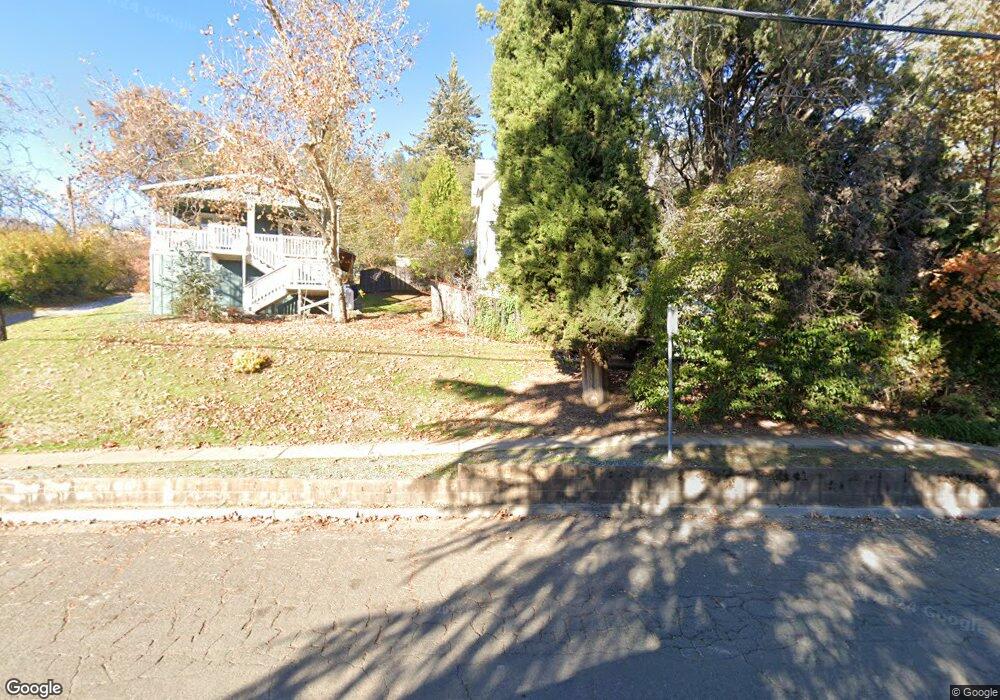
615 Bee St Placerville, CA 95667
Estimated Value: $452,495 - $508,000
3
Beds
2
Baths
2,000
Sq Ft
$238/Sq Ft
Est. Value
About This Home
This home is located at 615 Bee St, Placerville, CA 95667 and is currently estimated at $475,374, approximately $237 per square foot. 615 Bee St is a home located in El Dorado County with nearby schools including El Dorado High School, Country Day Montessori, and El Dorado Adventist School.
Ownership History
Date
Name
Owned For
Owner Type
Purchase Details
Closed on
Oct 5, 2009
Sold by
Merlo Susanne
Bought by
Seven Central Pacific Llc
Current Estimated Value
Purchase Details
Closed on
Feb 1, 2005
Sold by
Hardy Michael R and Hardy Sharon L
Bought by
Merlo Susanne
Home Financials for this Owner
Home Financials are based on the most recent Mortgage that was taken out on this home.
Original Mortgage
$336,000
Interest Rate
6.5%
Mortgage Type
Purchase Money Mortgage
Purchase Details
Closed on
Mar 12, 2001
Sold by
Eubanks Charles A and Norris Eubanks Sharon
Bought by
Hardy Michael R and Hardy Sharon L
Purchase Details
Closed on
Feb 4, 1994
Sold by
Bukema Marvin J
Bought by
Hardy Michael R and Hardy Sharon L
Home Financials for this Owner
Home Financials are based on the most recent Mortgage that was taken out on this home.
Original Mortgage
$120,600
Interest Rate
7.1%
Create a Home Valuation Report for This Property
The Home Valuation Report is an in-depth analysis detailing your home's value as well as a comparison with similar homes in the area
Home Values in the Area
Average Home Value in this Area
Purchase History
| Date | Buyer | Sale Price | Title Company |
|---|---|---|---|
| Seven Central Pacific Llc | $179,393 | Accommodation | |
| Merlo Susanne | $336,000 | Placer Title Co | |
| Hardy Michael R | $28,000 | First American Title Ins Co | |
| Hardy Michael R | -- | Chicago Title Company |
Source: Public Records
Mortgage History
| Date | Status | Borrower | Loan Amount |
|---|---|---|---|
| Previous Owner | Merlo Susanne | $336,000 | |
| Previous Owner | Hardy Michael R | $120,600 |
Source: Public Records
Tax History
| Year | Tax Paid | Tax Assessment Tax Assessment Total Assessment is a certain percentage of the fair market value that is determined by local assessors to be the total taxable value of land and additions on the property. | Land | Improvement |
|---|---|---|---|---|
| 2025 | $2,956 | $283,961 | $90,347 | $193,614 |
| 2024 | $2,956 | $278,394 | $88,576 | $189,818 |
| 2023 | $2,922 | $272,937 | $86,840 | $186,097 |
| 2022 | $2,881 | $267,587 | $85,138 | $182,449 |
| 2021 | $2,848 | $262,341 | $83,469 | $178,872 |
| 2020 | $2,806 | $259,652 | $82,614 | $177,038 |
| 2019 | $2,772 | $254,562 | $80,995 | $173,567 |
| 2018 | $2,689 | $249,571 | $79,407 | $170,164 |
| 2017 | $2,649 | $244,678 | $77,850 | $166,828 |
| 2016 | $2,610 | $239,881 | $76,324 | $163,557 |
| 2015 | $2,491 | $236,280 | $75,179 | $161,101 |
| 2014 | $2,491 | $231,654 | $73,707 | $157,947 |
Source: Public Records
Map
Nearby Homes
- 545 Fairview Dr
- 2796 Coloma St
- 837 Vivian Ct
- 2812 Bronzecrest St
- 2905 Wood St
- 837 Hillcrest St
- 2816 Holly Ct
- 2968 Coloma St
- 629 James Dr
- 918 Woodpecker Ct
- 664 David Cir
- 525 Skyline Dr
- 901 Union St
- 691 David Cir
- 8325 County Rd M44
- 0 Big Cut Rd Unit 225072888
- 813 Blue Bell Ct
- 966 Lincoln St
- 810 Phillip Ct
- 2603 Kereka Ct
Your Personal Tour Guide
Ask me questions while you tour the home.