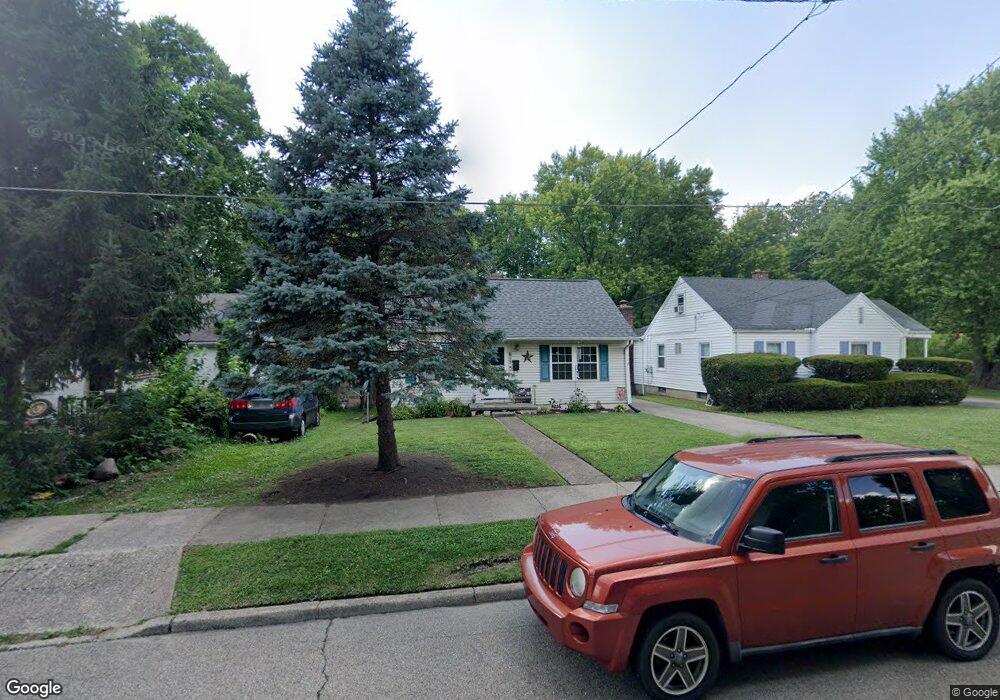
615 Bridge St Franklin, OH 45005
Estimated Value: $147,256 - $175,000
2
Beds
1
Bath
720
Sq Ft
$224/Sq Ft
Est. Value
About This Home
This home is located at 615 Bridge St, Franklin, OH 45005 and is currently estimated at $161,314, approximately $224 per square foot. 615 Bridge St is a home located in Warren County with nearby schools including Franklin High School.
Ownership History
Date
Name
Owned For
Owner Type
Purchase Details
Closed on
Nov 5, 2001
Sold by
Powell Joann
Bought by
Dalton Julie N
Current Estimated Value
Purchase Details
Closed on
Aug 6, 1999
Sold by
Russell Terry
Bought by
Willis Marvin W and Willis Joann P
Home Financials for this Owner
Home Financials are based on the most recent Mortgage that was taken out on this home.
Original Mortgage
$81,134
Interest Rate
7.68%
Mortgage Type
FHA
Purchase Details
Closed on
Apr 26, 1994
Sold by
Wilson Cynthia J and Wilson Cynthia J
Bought by
Russell and Russell Todd A
Purchase Details
Closed on
Jan 2, 1991
Sold by
Grizzell Wm. R and Grizzell Almaje
Bought by
Wilson and Wilson Cynthia J
Purchase Details
Closed on
Jul 20, 1983
Sold by
Henderson Jon V and Henderson Brend
Bought by
Grizzell and Grizzell Wm R
Purchase Details
Closed on
Apr 5, 1979
Sold by
Richardson Richardson and Richardson Brenda S
Purchase Details
Closed on
Oct 27, 1978
Sold by
Richardson Richardson and Richardson Glenn
Create a Home Valuation Report for This Property
The Home Valuation Report is an in-depth analysis detailing your home's value as well as a comparison with similar homes in the area
Home Values in the Area
Average Home Value in this Area
Purchase History
| Date | Buyer | Sale Price | Title Company |
|---|---|---|---|
| Dalton Julie N | $86,000 | -- | |
| Willis Marvin W | $81,575 | -- | |
| Russell | $47,000 | -- | |
| Wilson | $39,900 | -- | |
| Grizzell | $28,500 | -- | |
| -- | $23,900 | -- | |
| -- | -- | -- |
Source: Public Records
Mortgage History
| Date | Status | Borrower | Loan Amount |
|---|---|---|---|
| Previous Owner | Willis Marvin W | $81,134 | |
| Closed | Dalton Julie N | -- |
Source: Public Records
Tax History Compared to Growth
Tax History
| Year | Tax Paid | Tax Assessment Tax Assessment Total Assessment is a certain percentage of the fair market value that is determined by local assessors to be the total taxable value of land and additions on the property. | Land | Improvement |
|---|---|---|---|---|
| 2024 | $2,169 | $37,840 | $8,970 | $28,870 |
| 2023 | $1,703 | $28,721 | $5,085 | $23,635 |
| 2022 | $1,674 | $28,721 | $5,086 | $23,636 |
| 2021 | $1,597 | $28,721 | $5,086 | $23,636 |
| 2020 | $1,457 | $22,792 | $4,036 | $18,757 |
| 2019 | $1,342 | $22,792 | $4,036 | $18,757 |
| 2018 | $1,131 | $22,792 | $4,036 | $18,757 |
| 2017 | $1,383 | $21,553 | $3,878 | $17,675 |
| 2016 | $1,406 | $21,553 | $3,878 | $17,675 |
| 2015 | $1,406 | $21,553 | $3,878 | $17,675 |
| 2014 | $1,226 | $21,550 | $3,880 | $17,680 |
| 2013 | $1,052 | $24,930 | $4,480 | $20,450 |
Source: Public Records
Map
Nearby Homes
- 121 Boys Ave
- 102 Warren Ave
- 315 Bridge St
- 228 Bridge St
- 0 Victoria Dr Unit 942075
- 0 Victoria Dr Unit 1852824
- 1012 Gribble Dr
- 324 Cris Ct
- 209 Rossman Ct
- 212 Rossman Ct
- 42 N River St
- 413 Spring Ave
- 605 Spring Ave
- 56 Skokiaan Dr
- 410 Park Ave
- 551 E 2nd St
- 509 Forest Ave
- 511 Forest Ave
- 520 Arlington Ave
- 5575 Fairview Dr