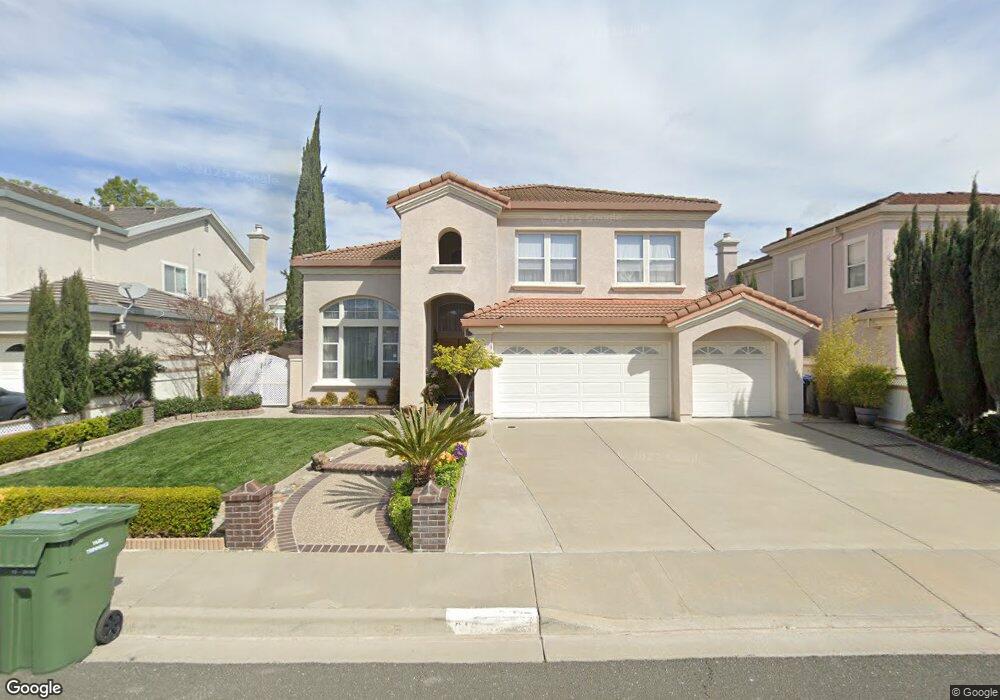
615 Clyde Ct Milpitas, CA 95035
Estimated Value: $2,075,000 - $2,670,000
4
Beds
3
Baths
2,590
Sq Ft
$906/Sq Ft
Est. Value
About This Home
This home is located at 615 Clyde Ct, Milpitas, CA 95035 and is currently estimated at $2,345,709, approximately $905 per square foot. 615 Clyde Ct is a home located in Santa Clara County with nearby schools including Curtner Elementary School, Thomas Russell Middle School, and Milpitas High School.
Ownership History
Date
Name
Owned For
Owner Type
Purchase Details
Closed on
Feb 4, 2007
Sold by
Hon David and Hon Yen
Bought by
Hon David and Hon Yen
Current Estimated Value
Purchase Details
Closed on
Jun 18, 1996
Sold by
Shapell Industries Inc
Bought by
Hon David K and Hon Yen
Home Financials for this Owner
Home Financials are based on the most recent Mortgage that was taken out on this home.
Original Mortgage
$185,000
Outstanding Balance
$12,089
Interest Rate
8.25%
Estimated Equity
$2,333,620
Create a Home Valuation Report for This Property
The Home Valuation Report is an in-depth analysis detailing your home's value as well as a comparison with similar homes in the area
Home Values in the Area
Average Home Value in this Area
Purchase History
| Date | Buyer | Sale Price | Title Company |
|---|---|---|---|
| Hon David | -- | None Available | |
| Hon David K | $402,000 | First American Title Guarant |
Source: Public Records
Mortgage History
| Date | Status | Borrower | Loan Amount |
|---|---|---|---|
| Open | Hon David K | $185,000 |
Source: Public Records
Tax History
| Year | Tax Paid | Tax Assessment Tax Assessment Total Assessment is a certain percentage of the fair market value that is determined by local assessors to be the total taxable value of land and additions on the property. | Land | Improvement |
|---|---|---|---|---|
| 2025 | $7,587 | $667,639 | $249,177 | $418,462 |
| 2024 | $7,587 | $654,549 | $244,292 | $410,257 |
| 2023 | $7,485 | $641,715 | $239,502 | $402,213 |
| 2022 | $7,614 | $629,133 | $234,806 | $394,327 |
| 2021 | $7,502 | $616,798 | $230,202 | $386,596 |
| 2020 | $7,371 | $610,474 | $227,842 | $382,632 |
| 2019 | $7,287 | $598,505 | $223,375 | $375,130 |
| 2018 | $6,921 | $586,771 | $218,996 | $367,775 |
| 2017 | $6,831 | $575,266 | $214,702 | $360,564 |
| 2016 | $6,554 | $563,988 | $210,493 | $353,495 |
| 2015 | $6,486 | $555,518 | $207,332 | $348,186 |
| 2014 | $6,308 | $544,637 | $203,271 | $341,366 |
Source: Public Records
Map
Nearby Homes
- 685 Parvin Dr
- 1000 Jacklin Rd
- 7280 Marylinn Dr
- 0 Railroad Ave
- 137 Caladenia Ln
- 808 Cameron Cir
- 102 Marylinn Dr
- 60 Jacklin Place
- 170 Marylinn Dr
- 207 Redwood Ave
- 1103 Creed St
- 496 Dempsey Rd Unit 199
- 484 Dempsey Rd Unit 186
- 397 S Park Victoria Dr
- 50 Serra Way
- 258 Lynn Ave
- 1308 N Hillview Dr
- 1006 N Abbott Ave
- 1008 N Abbott Ave
- 1647 Jupiter Dr
Your Personal Tour Guide
Ask me questions while you tour the home.