615 David Ct Merced, CA 95340
North Merced NeighborhoodEstimated Value: $377,595 - $425,000
4
Beds
2
Baths
1,900
Sq Ft
$215/Sq Ft
Est. Value
About This Home
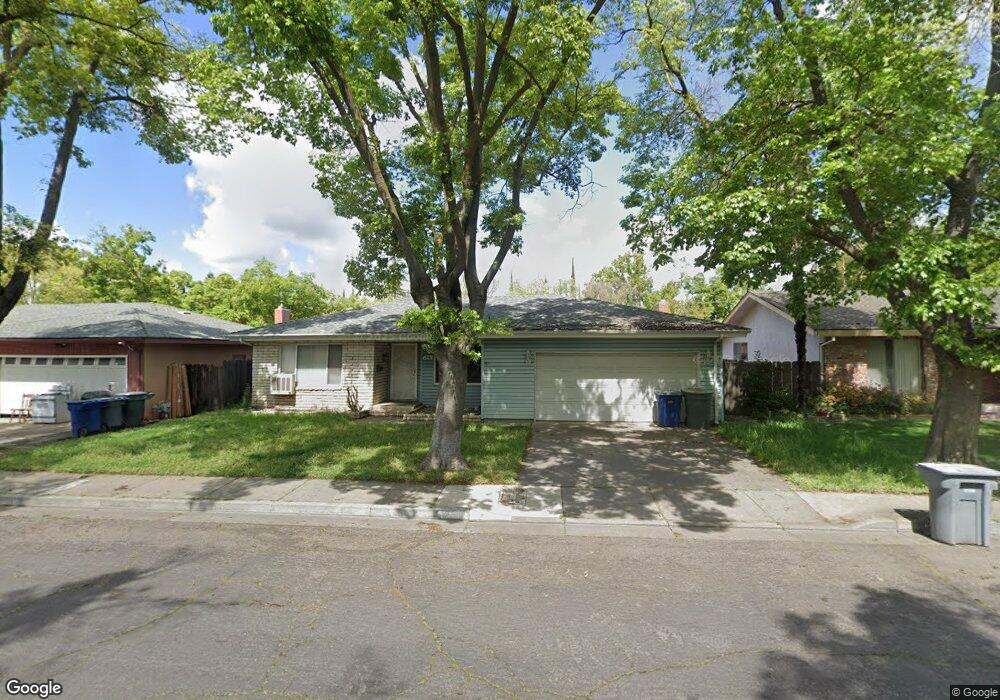
This home is located at 615 David Ct, Merced, CA 95340 and is currently estimated at $408,649, approximately $215 per square foot. 615 David Ct is a home located in Merced County with nearby schools including Luther Burbank Elementary School, Herbert Hoover Middle School, and Merced High School.
Ownership History
Date
Name
Owned For
Owner Type
Purchase Details
Closed on
Sep 1, 2009
Sold by
Kreischer Robert Dean
Bought by
Ballinger Jason Edward and Ballinger Sandylee
Current Estimated Value
Home Financials for this Owner
Home Financials are based on the most recent Mortgage that was taken out on this home.
Original Mortgage
$127,645
Outstanding Balance
$83,522
Interest Rate
5.2%
Mortgage Type
FHA
Estimated Equity
$325,127
Create a Home Valuation Report for This Property
The Home Valuation Report is an in-depth analysis detailing your home's value as well as a comparison with similar homes in the area
Home Values in the Area
Average Home Value in this Area
Purchase History
| Date | Buyer | Sale Price | Title Company |
|---|---|---|---|
| Ballinger Jason Edward | $130,000 | First American Title Company |
Source: Public Records
Mortgage History
| Date | Status | Borrower | Loan Amount |
|---|---|---|---|
| Open | Ballinger Jason Edward | $127,645 |
Source: Public Records
Tax History
| Year | Tax Paid | Tax Assessment Tax Assessment Total Assessment is a certain percentage of the fair market value that is determined by local assessors to be the total taxable value of land and additions on the property. | Land | Improvement |
|---|---|---|---|---|
| 2025 | $1,771 | $167,791 | $32,263 | $135,528 |
| 2024 | $1,771 | $164,502 | $31,631 | $132,871 |
| 2023 | $1,747 | $161,277 | $31,011 | $130,266 |
| 2022 | $1,723 | $158,115 | $30,403 | $127,712 |
| 2021 | $1,719 | $155,015 | $29,807 | $125,208 |
| 2020 | $1,731 | $153,427 | $29,502 | $123,925 |
| 2019 | $1,706 | $150,420 | $28,924 | $121,496 |
| 2018 | $1,556 | $147,471 | $28,357 | $119,114 |
| 2017 | $1,615 | $144,580 | $27,801 | $116,779 |
| 2016 | $1,590 | $141,746 | $27,256 | $114,490 |
| 2015 | $1,564 | $139,618 | $26,847 | $112,771 |
| 2014 | $1,531 | $136,884 | $26,322 | $110,562 |
Source: Public Records
Map
Nearby Homes
- 2848 Tahoe Dr
- 688 Elise Ct
- 2819 Tenaya Dr
- 2849 Montana Ave
- 2804 Mccombs Dr
- 0 E North Bear Creek Dr
- 1 E North Bear Creek Dr
- 891 Hansen Ave
- 425 E 27th St
- 950 E South Bear Creek Dr
- 2971 Chestnut Ave
- 1056 E Alexander Ave
- 27 Emerald Dr
- 1282 Carolina Dr
- 3045 Silver Elm Ct
- 3009 Colony Park Dr
- 2720 Glen Ave
- 439 E Olive Ave
- 2709 Agnes Way
- 3125 El Capitan Ave
Your Personal Tour Guide
Ask me questions while you tour the home.