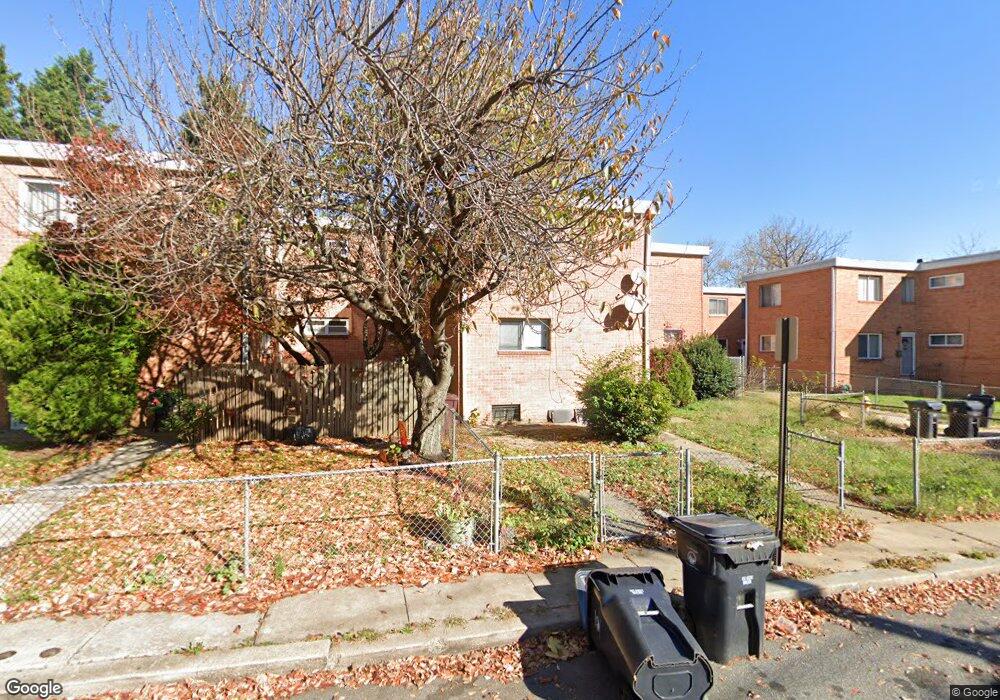
615 E 5th St Wilmington, DE 19801
Downtown Wilmington NeighborhoodEstimated Value: $103,000 - $199,000
3
Beds
1
Bath
1,260
Sq Ft
$121/Sq Ft
Est. Value
About This Home
This home is located at 615 E 5th St, Wilmington, DE 19801 and is currently estimated at $152,113, approximately $120 per square foot. 615 E 5th St is a home located in New Castle County with nearby schools including The Bancroft School, The Bayard School, and Newark High School.
Ownership History
Date
Name
Owned For
Owner Type
Purchase Details
Closed on
Oct 19, 2021
Sold by
One Pie Holdings Llc
Bought by
Basileia Realty Llc
Current Estimated Value
Home Financials for this Owner
Home Financials are based on the most recent Mortgage that was taken out on this home.
Original Mortgage
$56,250
Outstanding Balance
$51,295
Interest Rate
2.8%
Mortgage Type
Commercial
Estimated Equity
$100,818
Create a Home Valuation Report for This Property
The Home Valuation Report is an in-depth analysis detailing your home's value as well as a comparison with similar homes in the area
Home Values in the Area
Average Home Value in this Area
Purchase History
| Date | Buyer | Sale Price | Title Company |
|---|---|---|---|
| Basileia Realty Llc | $75,000 | None Available |
Source: Public Records
Mortgage History
| Date | Status | Borrower | Loan Amount |
|---|---|---|---|
| Open | Basileia Realty Llc | $56,250 |
Source: Public Records
Tax History
| Year | Tax Paid | Tax Assessment Tax Assessment Total Assessment is a certain percentage of the fair market value that is determined by local assessors to be the total taxable value of land and additions on the property. | Land | Improvement |
|---|---|---|---|---|
| 2024 | $929 | $25,200 | $3,600 | $21,600 |
| 2023 | $906 | $25,200 | $3,600 | $21,600 |
| 2022 | $896 | $25,200 | $3,600 | $21,600 |
| 2021 | $873 | $25,200 | $3,600 | $21,600 |
| 2020 | $848 | $25,200 | $3,600 | $21,600 |
| 2019 | $1,240 | $25,200 | $3,600 | $21,600 |
| 2018 | $748 | $25,200 | $3,600 | $21,600 |
| 2017 | $1,169 | $25,200 | $3,600 | $21,600 |
| 2016 | $1,169 | $25,200 | $3,600 | $21,600 |
| 2015 | $1,095 | $25,200 | $3,600 | $21,600 |
| 2014 | $1,094 | $25,200 | $3,600 | $21,600 |
Source: Public Records
Map
Nearby Homes
- 701 E 6th St
- 801 N Church St
- 511 E 3rd St
- 240 N Lombard St
- 524 Taylor St
- 508 Taylor St
- 810 N Church St
- 820 N Church St
- 836 Bennett St
- 841 Bennett St
- 847 Bennett St
- 849 Bennett St
- 850 Bennett St
- 903 Kirkwood St
- 901 N Church St
- 912 N Lombard St
- 914 N Lombard St
- 936 N Spruce St
- 321 E 9th St
- 739 E 10th St
Your Personal Tour Guide
Ask me questions while you tour the home.