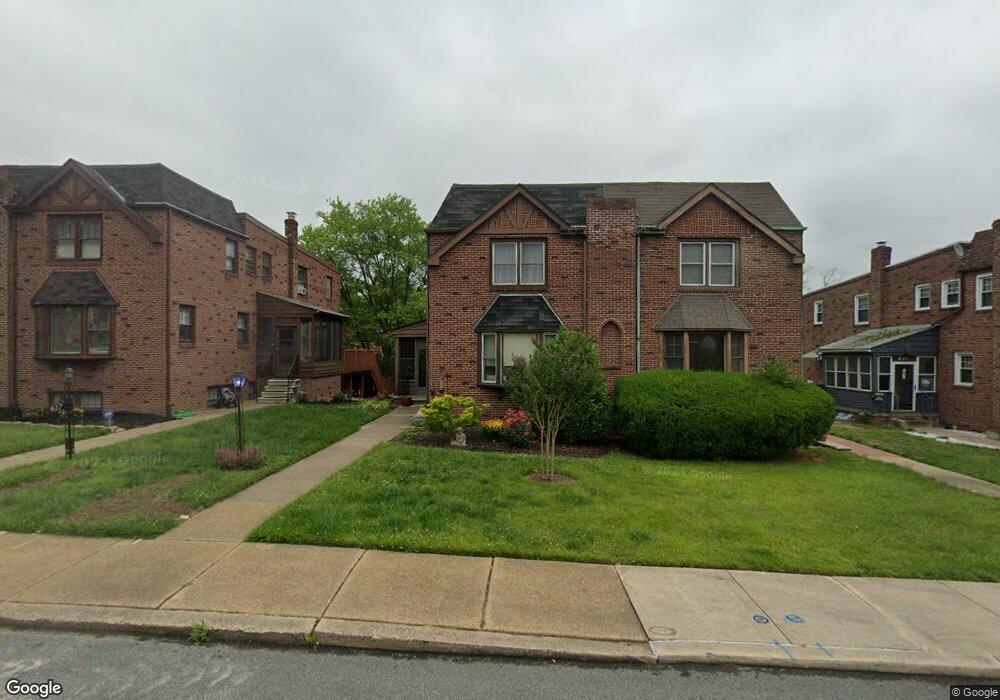
615 W 39th St Wilmington, DE 19802
Northwest Wilmington NeighborhoodEstimated Value: $285,000 - $401,000
4
Beds
3
Baths
1,900
Sq Ft
$173/Sq Ft
Est. Value
About This Home
This home is located at 615 W 39th St, Wilmington, DE 19802 and is currently estimated at $328,051, approximately $172 per square foot. 615 W 39th St is a home located in New Castle County with nearby schools including Harlan (David W. ) Elementary School, Pierre S. Dupont Middle School, and Concord High School.
Ownership History
Date
Name
Owned For
Owner Type
Purchase Details
Closed on
Jul 31, 2003
Sold by
Willis William L and Willis Dana M
Bought by
Milburn Narrinchai H
Current Estimated Value
Home Financials for this Owner
Home Financials are based on the most recent Mortgage that was taken out on this home.
Original Mortgage
$143,900
Interest Rate
6.8%
Mortgage Type
Purchase Money Mortgage
Create a Home Valuation Report for This Property
The Home Valuation Report is an in-depth analysis detailing your home's value as well as a comparison with similar homes in the area
Home Values in the Area
Average Home Value in this Area
Purchase History
| Date | Buyer | Sale Price | Title Company |
|---|---|---|---|
| Milburn Narrinchai H | $159,900 | -- |
Source: Public Records
Mortgage History
| Date | Status | Borrower | Loan Amount |
|---|---|---|---|
| Previous Owner | Milburn Narrinchai H | $143,900 | |
| Closed | Milburn Narrinchai H | $7,995 |
Source: Public Records
Tax History Compared to Growth
Tax History
| Year | Tax Paid | Tax Assessment Tax Assessment Total Assessment is a certain percentage of the fair market value that is determined by local assessors to be the total taxable value of land and additions on the property. | Land | Improvement |
|---|---|---|---|---|
| 2024 | $1,706 | $52,800 | $9,400 | $43,400 |
| 2023 | $1,548 | $52,800 | $9,400 | $43,400 |
| 2022 | $1,565 | $52,800 | $9,400 | $43,400 |
| 2021 | $1,563 | $52,800 | $9,400 | $43,400 |
| 2020 | $1,566 | $52,800 | $9,400 | $43,400 |
| 2019 | $2,627 | $52,800 | $9,400 | $43,400 |
| 2018 | $1,514 | $52,800 | $9,400 | $43,400 |
| 2017 | $1,503 | $52,800 | $9,400 | $43,400 |
| 2016 | $1,502 | $52,800 | $9,400 | $43,400 |
| 2015 | $2,343 | $52,800 | $9,400 | $43,400 |
| 2014 | $2,342 | $52,800 | $9,400 | $43,400 |
Source: Public Records
Map
Nearby Homes
- 508 W 39th St
- 601 Coverly Rd
- 707 W 38th St
- 804 W Matson Run Pkwy
- 714 W 38th St
- 310 W 37th St
- 3601 N Madison St
- 4316 Miller Rd
- 4318 Miller Rd
- 411 W 34th St
- 306 W 35th St
- 213 W 35th St
- 504 W 34th St
- 4314 Miller Rd
- 25 W 39th St
- 202 W 35th St
- 16 W 38th St
- 4404 Miller Rd
- 3107 N Monroe St
- 3100 N Madison St