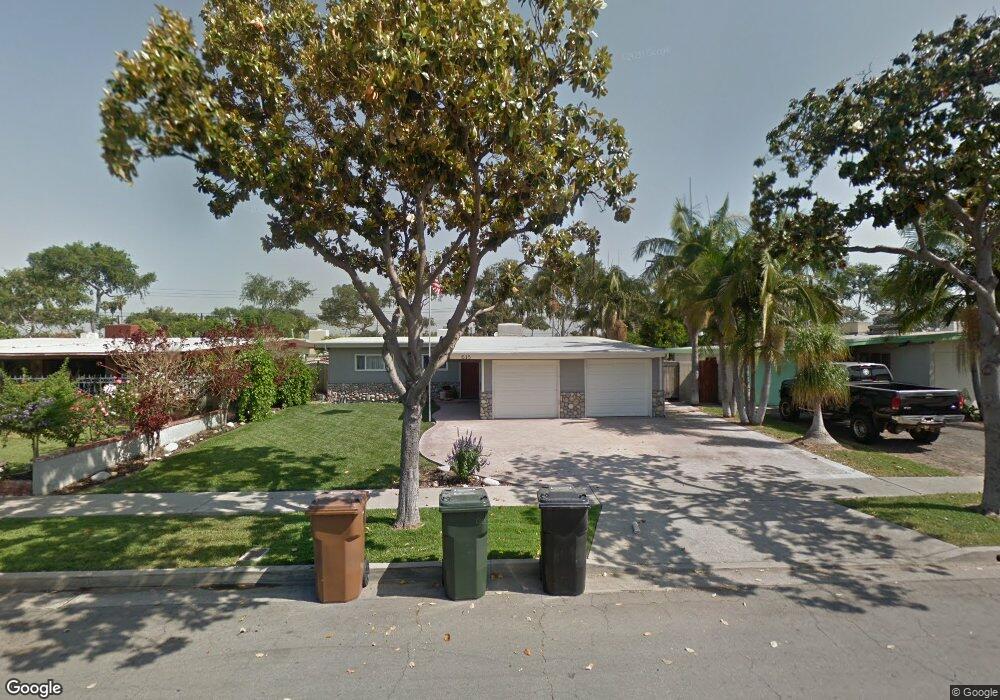
615 W Elm Ave Fullerton, CA 92832
Estimated Value: $835,592 - $914,000
3
Beds
2
Baths
1,176
Sq Ft
$740/Sq Ft
Est. Value
About This Home
This home is located at 615 W Elm Ave, Fullerton, CA 92832 and is currently estimated at $869,898, approximately $739 per square foot. 615 W Elm Ave is a home located in Orange County with nearby schools including Richman Elementary School, Nicolas Junior High School, and Fullerton Union High School.
Ownership History
Date
Name
Owned For
Owner Type
Purchase Details
Closed on
Nov 22, 2010
Sold by
Torres Benjamin Albert
Bought by
Torres Benjamin Albert and Torres Jennifer L
Current Estimated Value
Home Financials for this Owner
Home Financials are based on the most recent Mortgage that was taken out on this home.
Original Mortgage
$282,000
Outstanding Balance
$185,204
Interest Rate
4.18%
Mortgage Type
New Conventional
Estimated Equity
$684,694
Purchase Details
Closed on
Jun 7, 2001
Sold by
Figueroa Gregory James and Torres Figueroa Rita Rene
Bought by
Torres Benjamin Albert
Home Financials for this Owner
Home Financials are based on the most recent Mortgage that was taken out on this home.
Original Mortgage
$168,000
Interest Rate
7.15%
Purchase Details
Closed on
Jul 27, 1995
Sold by
Figueroa Gregory James and Figueroa Rita Rene
Bought by
Figueroa Gregory James and Torres Figueroa Rita Rene
Create a Home Valuation Report for This Property
The Home Valuation Report is an in-depth analysis detailing your home's value as well as a comparison with similar homes in the area
Home Values in the Area
Average Home Value in this Area
Purchase History
| Date | Buyer | Sale Price | Title Company |
|---|---|---|---|
| Torres Benjamin Albert | -- | Lawyers Title | |
| Torres Benjamin Albert | -- | Chicago Title Co | |
| Figueroa Gregory James | -- | First American Title Ins Co |
Source: Public Records
Mortgage History
| Date | Status | Borrower | Loan Amount |
|---|---|---|---|
| Open | Torres Benjamin Albert | $282,000 | |
| Closed | Torres Benjamin Albert | $168,000 |
Source: Public Records
Tax History Compared to Growth
Tax History
| Year | Tax Paid | Tax Assessment Tax Assessment Total Assessment is a certain percentage of the fair market value that is determined by local assessors to be the total taxable value of land and additions on the property. | Land | Improvement |
|---|---|---|---|---|
| 2025 | $3,293 | $284,512 | $220,973 | $63,539 |
| 2024 | $3,293 | $278,934 | $216,640 | $62,294 |
| 2023 | $3,210 | $273,465 | $212,392 | $61,073 |
| 2022 | $3,183 | $268,103 | $208,227 | $59,876 |
| 2021 | $3,127 | $262,847 | $204,145 | $58,702 |
| 2020 | $3,109 | $260,152 | $202,051 | $58,101 |
| 2019 | $3,031 | $255,051 | $198,089 | $56,962 |
| 2018 | $2,985 | $250,050 | $194,204 | $55,846 |
| 2017 | $2,935 | $245,148 | $190,397 | $54,751 |
| 2016 | $2,874 | $240,342 | $186,664 | $53,678 |
| 2015 | $2,795 | $236,732 | $183,860 | $52,872 |
| 2014 | $2,715 | $232,095 | $180,258 | $51,837 |
Source: Public Records
Map
Nearby Homes
- 616 W Ash Ave
- 530 W Elm Ave
- 540 W Knepp Ave
- 601 W Southgate Ave
- 340 Via Amor Place
- 443 W Southgate Ave
- 425 W Knepp Ave
- 430 W Knepp Ave
- 620 S Ford Ave
- 600 S Ford Ave
- 718 S Euclid St
- 442 W Porter Ave
- 611 S Highland Ave
- 700 S Orange Ave
- 654 W Gage Ave
- 539 W Amerige Ave
- 467 W Roberta Ave
- 1311 Clementine Way
- 121 W Elm Ave
- 119 W Valencia Dr