Estimated Value: $669,000 - $728,000
4
Beds
2
Baths
1,196
Sq Ft
$582/Sq Ft
Est. Value
About This Home
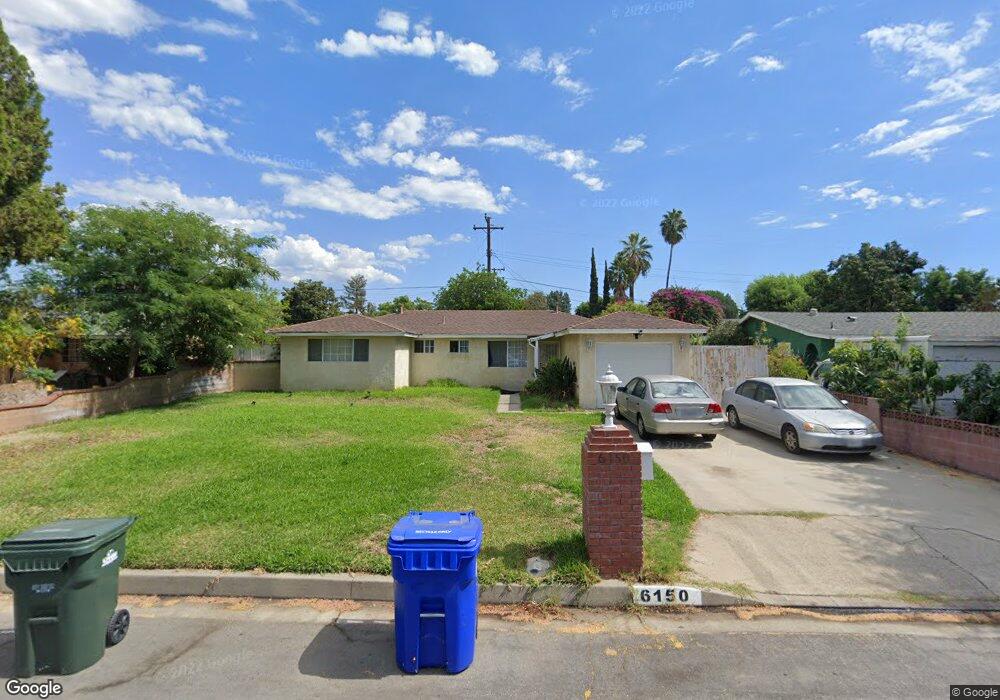
This home is located at 6150 N Factor Ave, Azusa, CA 91702 and is currently estimated at $695,737, approximately $581 per square foot. 6150 N Factor Ave is a home located in Los Angeles County with nearby schools including Azusa High School, St. Frances of Rome School, and Foothill Christian.
Ownership History
Date
Name
Owned For
Owner Type
Purchase Details
Closed on
Mar 14, 2002
Sold by
Aguilar Juana
Bought by
Lopez Mike R
Current Estimated Value
Home Financials for this Owner
Home Financials are based on the most recent Mortgage that was taken out on this home.
Original Mortgage
$157,600
Outstanding Balance
$64,198
Interest Rate
6.85%
Estimated Equity
$631,539
Purchase Details
Closed on
Feb 28, 2002
Sold by
Peratt Suzanne Lynn
Bought by
Peratt John F
Home Financials for this Owner
Home Financials are based on the most recent Mortgage that was taken out on this home.
Original Mortgage
$157,600
Outstanding Balance
$64,198
Interest Rate
6.85%
Estimated Equity
$631,539
Purchase Details
Closed on
Feb 22, 2002
Sold by
Peratt John F and Peratt John Federick
Bought by
Lopez Mike R
Home Financials for this Owner
Home Financials are based on the most recent Mortgage that was taken out on this home.
Original Mortgage
$157,600
Outstanding Balance
$64,198
Interest Rate
6.85%
Estimated Equity
$631,539
Create a Home Valuation Report for This Property
The Home Valuation Report is an in-depth analysis detailing your home's value as well as a comparison with similar homes in the area
Home Values in the Area
Average Home Value in this Area
Purchase History
| Date | Buyer | Sale Price | Title Company |
|---|---|---|---|
| Lopez Mike R | -- | North American Title Co | |
| Peratt John F | -- | North American Title Co | |
| Lopez Mike R | $197,000 | North American Title Co |
Source: Public Records
Mortgage History
| Date | Status | Borrower | Loan Amount |
|---|---|---|---|
| Open | Lopez Mike R | $157,600 |
Source: Public Records
Tax History
| Year | Tax Paid | Tax Assessment Tax Assessment Total Assessment is a certain percentage of the fair market value that is determined by local assessors to be the total taxable value of land and additions on the property. | Land | Improvement |
|---|---|---|---|---|
| 2025 | $3,781 | $291,002 | $193,366 | $97,636 |
| 2024 | $3,781 | $285,297 | $189,575 | $95,722 |
| 2023 | $3,672 | $279,704 | $185,858 | $93,846 |
| 2022 | $3,625 | $274,220 | $182,214 | $92,006 |
| 2021 | $3,534 | $268,844 | $178,642 | $90,202 |
| 2019 | $3,420 | $260,873 | $173,345 | $87,528 |
| 2018 | $3,249 | $255,759 | $169,947 | $85,812 |
| 2016 | $3,126 | $245,830 | $163,349 | $82,481 |
| 2015 | $3,087 | $242,139 | $160,896 | $81,243 |
| 2014 | $2,896 | $237,397 | $157,745 | $79,652 |
Source: Public Records
Map
Nearby Homes
- 6014 N Fairvale Dr
- 312 N Fenimore Ave
- 329 N Fenimore Ave
- 1130 E Alosta Ave Unit B102
- 5902 N Viceroy Ave
- 716 E Hanks St
- 19003 E Haltern Ave
- 18453 E Armstead St
- 6003 N Briargate Ln
- 18824 E Armstead St
- 839 Alford St
- 840 E Foothill Blvd Unit 51
- 840 E Foothill Blvd Unit 64
- 840 E Foothill Blvd Unit 203
- 840 E Foothill Blvd Unit 164
- 840 E Foothill Blvd Unit 27
- 840 E Foothill Blvd Unit 144
- 402 N Cerritos Ave
- 404 N Cerritos Ave
- 5825 N Orangecrest Ave
- 6144 N Factor Ave
- 6156 N Factor Ave
- 18554 E Mauna Loa Ave
- 6141 N Goodway Dr
- 6138 N Factor Ave
- 6145 N Goodway Dr
- 18560 E Mauna Loa Ave
- 18532 E Mauna Loa Ave
- 18533 E Linfield St
- 6137 N Goodway Dr
- 6132 N Factor Ave
- 18602 E Mauna Loa Ave
- 18526 E Mauna Loa Ave
- 18527 E Linfield St
- 6144 N Goodway Dr
- 931 E Mauna Loa Ave
- 935 E Mauna Loa Ave
- 6131 N Goodway Dr
- 18532 E Linfield St
- 939 E Mauna Loa Ave
Your Personal Tour Guide
Ask me questions while you tour the home.