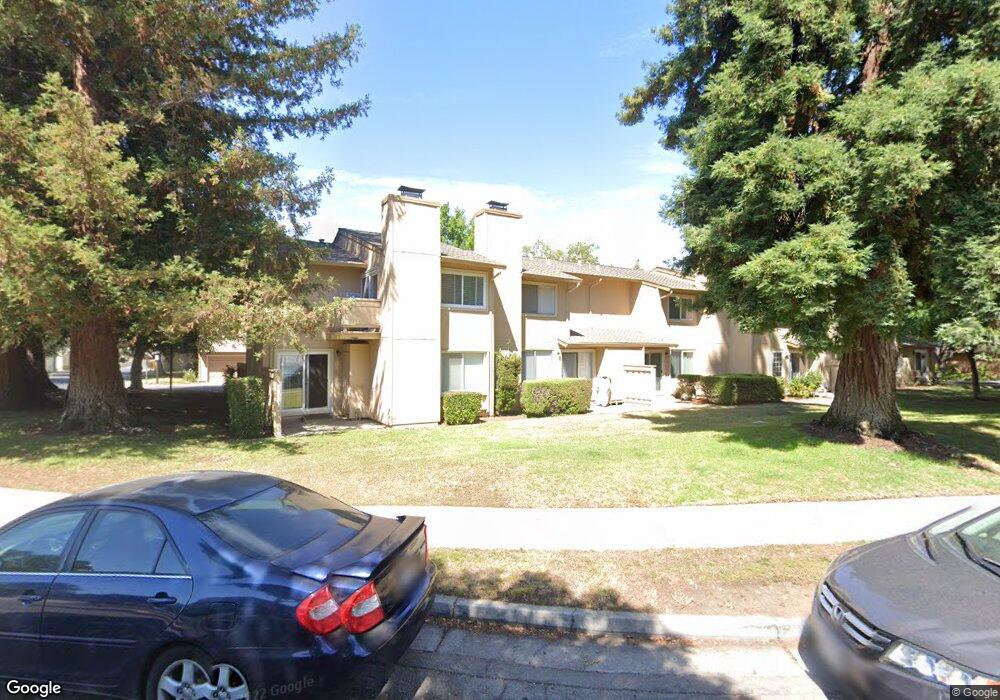
6156 Regency Oaks Dr San Jose, CA 95129
West San Jose NeighborhoodEstimated Value: $1,552,000 - $1,827,000
3
Beds
3
Baths
1,532
Sq Ft
$1,108/Sq Ft
Est. Value
About This Home
This home is located at 6156 Regency Oaks Dr, San Jose, CA 95129 and is currently estimated at $1,697,751, approximately $1,108 per square foot. 6156 Regency Oaks Dr is a home located in Santa Clara County with nearby schools including Nelson S. Dilworth Elementary School, Joaquin Miller Middle, and Lynbrook High School.
Ownership History
Date
Name
Owned For
Owner Type
Purchase Details
Closed on
Jun 12, 2019
Sold by
Jacobson Jay
Bought by
Jacobson Jay and Feuer Sheila L
Current Estimated Value
Create a Home Valuation Report for This Property
The Home Valuation Report is an in-depth analysis detailing your home's value as well as a comparison with similar homes in the area
Home Values in the Area
Average Home Value in this Area
Purchase History
| Date | Buyer | Sale Price | Title Company |
|---|---|---|---|
| Jacobson Jay | -- | None Available |
Source: Public Records
Tax History Compared to Growth
Tax History
| Year | Tax Paid | Tax Assessment Tax Assessment Total Assessment is a certain percentage of the fair market value that is determined by local assessors to be the total taxable value of land and additions on the property. | Land | Improvement |
|---|---|---|---|---|
| 2025 | $4,940 | $294,614 | $73,625 | $220,989 |
| 2024 | $4,940 | $288,838 | $72,182 | $216,656 |
| 2023 | $4,842 | $283,175 | $70,767 | $212,408 |
| 2022 | $5,009 | $277,624 | $69,380 | $208,244 |
| 2021 | $4,889 | $272,181 | $68,020 | $204,161 |
| 2020 | $4,760 | $269,391 | $67,323 | $202,068 |
| 2019 | $4,643 | $264,109 | $66,003 | $198,106 |
| 2018 | $4,518 | $258,931 | $64,709 | $194,222 |
| 2017 | $4,483 | $253,855 | $63,441 | $190,414 |
| 2016 | $4,341 | $248,879 | $62,198 | $186,681 |
| 2015 | $4,303 | $245,141 | $61,264 | $183,877 |
| 2014 | $3,830 | $240,340 | $60,064 | $180,276 |
Source: Public Records
Map
Nearby Homes
- 1063 Whitebick Dr
- 6117 Brigantine Dr
- 1083 Miller Ave
- 1017 Craig Dr
- 18980 Newsom Ave
- 1040 W Riverside Way
- 10800 W Estates Dr
- 5688 Kimberly St
- 6757 Devonshire Dr
- 10860 Johnson Ave
- 5597 Glenoak Ct
- 1018 Huntingdon Dr
- 1002 Oaktree Dr
- 1366 Glenmoor Way
- 18901 Tuggle Ave
- 10357 Greenwood Ct
- 18817 Tuggle Ave
- 5635 W Walbrook Dr
- 1154 Bentoak Ln
- 1681 Danromas Way
- 6158 Regency Oaks Dr
- 6154 Regency Oaks Dr
- 6152 Regency Oaks Dr
- 6150 Regency Oaks Dr
- 6148 Regency Oaks Dr
- 6157 Regency Oaks Dr
- 6155 Regency Oaks Dr
- 6159 Regency Oaks Dr
- 1065 Whitebick Dr
- 1069 Whitebick Dr
- 1164 Hyde Ave
- 1061 Whitebick Dr
- 1072 Whitebick Dr
- 1049 Forest Knoll Dr
- 1044 Forest Knoll Dr
- 1071 Whitebick Dr
- 1047 Forest Knoll Dr
- 1166 Hyde Ave
- 1081 Di Napoli Dr
- 1045 Forest Knoll Dr