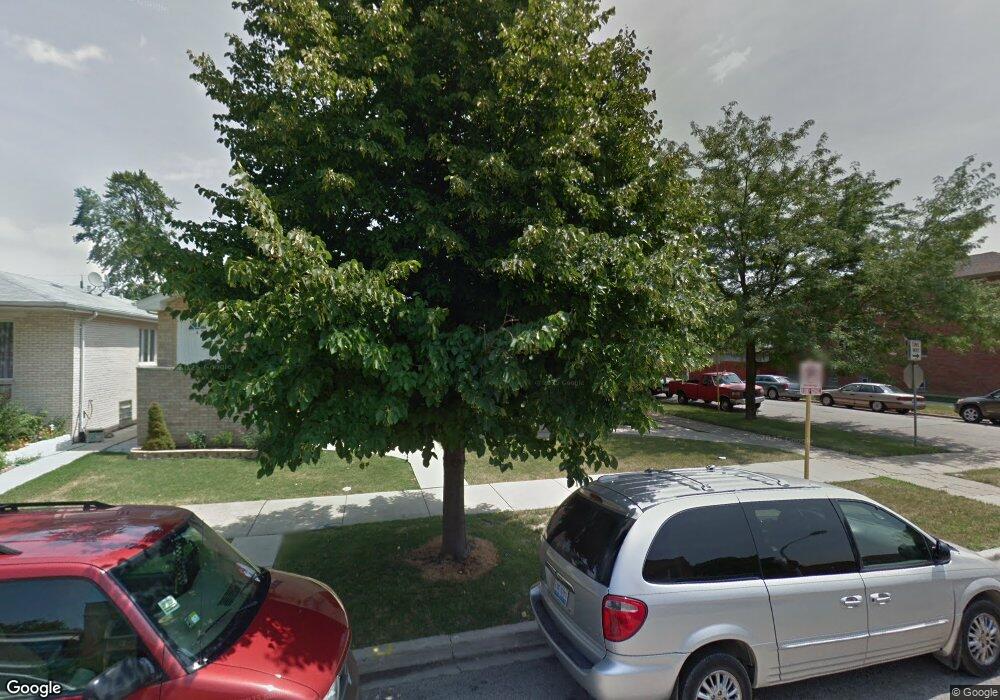
6159 S Monitor Ave Chicago, IL 60638
Clearing NeighborhoodEstimated Value: $428,813 - $514,000
4
Beds
3
Baths
1,448
Sq Ft
$323/Sq Ft
Est. Value
About This Home
This home is located at 6159 S Monitor Ave, Chicago, IL 60638 and is currently estimated at $467,453, approximately $322 per square foot. 6159 S Monitor Ave is a home located in Cook County with nearby schools including Hale Elementary School, Kennedy High School, and St. Symphorosa Catholic School.
Ownership History
Date
Name
Owned For
Owner Type
Purchase Details
Closed on
Aug 7, 2018
Sold by
Rivera Cynthia
Bought by
Cruz Lissette Cecilia
Current Estimated Value
Home Financials for this Owner
Home Financials are based on the most recent Mortgage that was taken out on this home.
Original Mortgage
$276,000
Outstanding Balance
$241,604
Interest Rate
4.87%
Mortgage Type
New Conventional
Estimated Equity
$225,849
Purchase Details
Closed on
Apr 24, 2007
Sold by
Jpl Builders Inc
Bought by
Rivera Cynthia
Home Financials for this Owner
Home Financials are based on the most recent Mortgage that was taken out on this home.
Original Mortgage
$310,500
Interest Rate
6.2%
Mortgage Type
Unknown
Purchase Details
Closed on
May 17, 2004
Sold by
Messiah Evangelical Lutheran Church Of C
Bought by
Jpl Builders Inc
Create a Home Valuation Report for This Property
The Home Valuation Report is an in-depth analysis detailing your home's value as well as a comparison with similar homes in the area
Home Values in the Area
Average Home Value in this Area
Purchase History
| Date | Buyer | Sale Price | Title Company |
|---|---|---|---|
| Cruz Lissette Cecilia | $345,000 | Stewart Title | |
| Rivera Cynthia | $390,000 | Stewart Title Of Illinois | |
| Jpl Builders Inc | -- | Cti |
Source: Public Records
Mortgage History
| Date | Status | Borrower | Loan Amount |
|---|---|---|---|
| Open | Cruz Lissette Cecilia | $276,000 | |
| Previous Owner | Rivera Cynthia | $310,500 |
Source: Public Records
Tax History Compared to Growth
Tax History
| Year | Tax Paid | Tax Assessment Tax Assessment Total Assessment is a certain percentage of the fair market value that is determined by local assessors to be the total taxable value of land and additions on the property. | Land | Improvement |
|---|---|---|---|---|
| 2024 | $5,841 | $38,000 | $5,264 | $32,736 |
| 2023 | $5,673 | $31,000 | $4,700 | $26,300 |
| 2022 | $5,673 | $31,000 | $4,700 | $26,300 |
| 2021 | $5,564 | $31,000 | $4,700 | $26,300 |
| 2020 | $6,047 | $30,249 | $3,760 | $26,489 |
| 2019 | $6,064 | $33,611 | $3,760 | $29,851 |
| 2018 | $5,961 | $33,611 | $3,760 | $29,851 |
| 2017 | $5,264 | $27,828 | $3,384 | $24,444 |
| 2016 | $5,073 | $27,828 | $3,384 | $24,444 |
| 2015 | $4,619 | $27,828 | $3,384 | $24,444 |
| 2014 | $4,389 | $26,225 | $3,196 | $23,029 |
| 2013 | $4,291 | $26,225 | $3,196 | $23,029 |
Source: Public Records
Map
Nearby Homes
- 6152 S Austin Ave
- 6058 S Massasoit Ave
- 6037 S Mason Ave
- 6016 S Mayfield Ave
- 5817 W 64th St
- 6005 S Menard Ave
- 6123 S Meade Ave
- 6129 S Parkside Ave
- 6025 S Major Ave
- 5749 W 64th Place
- 6155 S Moody Ave
- 6054 W 64th St
- 6135 W 63rd Place
- 5631 W 64th Place
- 5533 W 63rd Place
- 6046 S Melvina Ave
- 5819 S Mason Ave
- 5827 S Austin Ave
- 6152 W 64th Place
- 5814 S Massasoit Ave
- 6159 S Monitor Ave
- 6155 S Monitor Ave
- 6153 S Monitor Ave
- 6149 S Monitor Ave
- 6147 S Monitor Ave
- 6201 S Monitor Ave
- 6201 S Monitor Ave
- 6145 S Monitor Ave
- 6158 S Menard Ave
- 6154 S Menard Ave
- 6152 S Menard Ave
- 6203 S Monitor Ave
- 6148 S Menard Ave
- 6141 S Monitor Ave
- 6146 S Menard Ave
- 6209 S Monitor Ave
- 6156 S Monitor Ave
- 6202 S Menard Ave
- 6152 S Monitor Ave
- 6137 S Monitor Ave