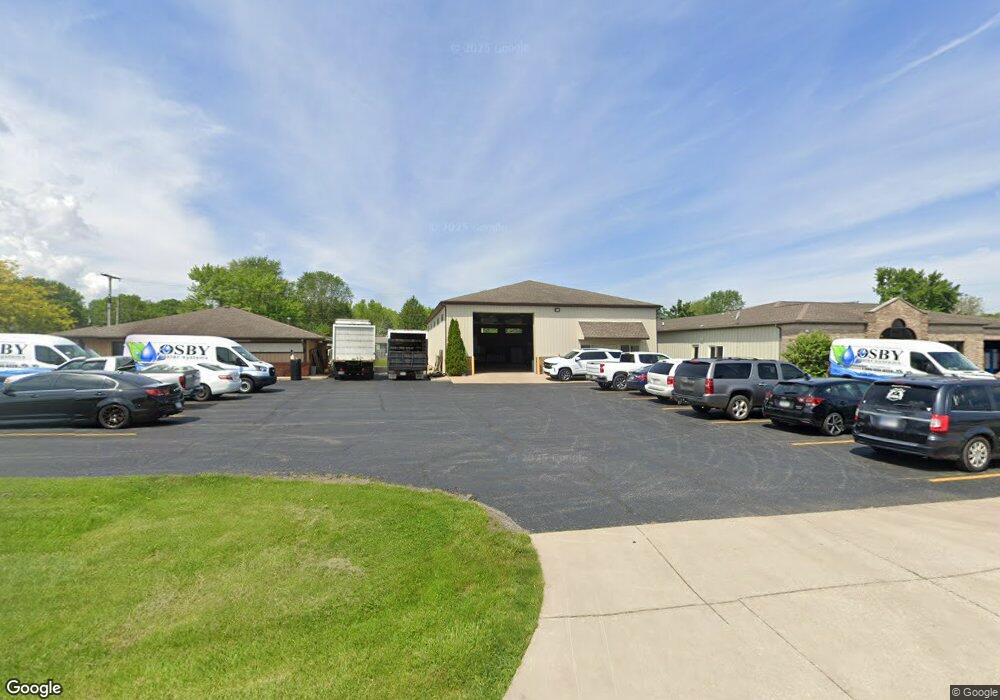
616 Front St Hebron, IN 46341
Porter County NeighborhoodEstimated Value: $332,980
Studio
--
Bath
2,000
Sq Ft
$166/Sq Ft
Est. Value
About This Home
This home is located at 616 Front St, Hebron, IN 46341 and is currently estimated at $332,980, approximately $166 per square foot. 616 Front St is a home located in Porter County with nearby schools including Hebron Elementary School, Hebron Middle School, and Hebron High School.
Ownership History
Date
Name
Owned For
Owner Type
Purchase Details
Closed on
Jun 30, 2015
Sold by
Osby James and Osby David E
Bought by
Osby Realty Llc
Current Estimated Value
Purchase Details
Closed on
Jun 29, 2015
Sold by
Osby David E and Earl Osby Trust
Bought by
Osby James and Osby David E
Purchase Details
Closed on
Apr 15, 2008
Sold by
Harris Jack A
Bought by
Jack Harris Investment Properties Hebron
Purchase Details
Closed on
Sep 7, 2007
Sold by
Family Express Corp
Bought by
Osby Earl and Earl Osby Trust
Create a Home Valuation Report for This Property
The Home Valuation Report is an in-depth analysis detailing your home's value as well as a comparison with similar homes in the area
Home Values in the Area
Average Home Value in this Area
Purchase History
| Date | Buyer | Sale Price | Title Company |
|---|---|---|---|
| Osby Realty Llc | -- | None Available | |
| Osby James | -- | None Available | |
| Jack Harris Investment Properties Hebron | -- | None Available | |
| Osby Earl | -- | Ticor Title Insurance |
Source: Public Records
Tax History
| Year | Tax Paid | Tax Assessment Tax Assessment Total Assessment is a certain percentage of the fair market value that is determined by local assessors to be the total taxable value of land and additions on the property. | Land | Improvement |
|---|---|---|---|---|
| 2024 | $5,317 | $208,700 | $56,800 | $151,900 |
| 2023 | $5,228 | $196,800 | $56,800 | $140,000 |
| 2022 | $5,158 | $186,800 | $56,800 | $130,000 |
| 2021 | $5,153 | $165,300 | $56,800 | $108,500 |
| 2020 | $5,551 | $172,300 | $56,800 | $115,500 |
| 2019 | $5,557 | $183,000 | $56,800 | $126,200 |
| 2018 | $5,916 | $183,800 | $56,800 | $127,000 |
| 2017 | $6,094 | $192,200 | $56,800 | $135,400 |
| 2016 | $6,101 | $200,400 | $56,000 | $144,400 |
| 2014 | -- | $195,800 | $53,400 | $142,400 |
| 2013 | -- | $215,000 | $57,600 | $157,400 |
Source: Public Records
Map
Nearby Homes
- 606 N Main St
- 79 Maple Ct
- 118 Cherry Ct
- 515 Tamarack Trail
- 709 W Wilson St
- 105 E Bates St
- 709 Beverly Dr
- 805 W Wilson St
- 1000 S State Road 2
- 308 E Bates St
- 585 Marcella St
- 435 Fry St
- 201 N Quincy St
- 203 N Quincy St
- 445 Bricker St
- 437 Fry St
- 587 Osburn St
- 902 Aspen St
- Henley Basement Plan at Park Ridge
- Sydney Basement Plan at Park Ridge
Your Personal Tour Guide
Ask me questions while you tour the home.