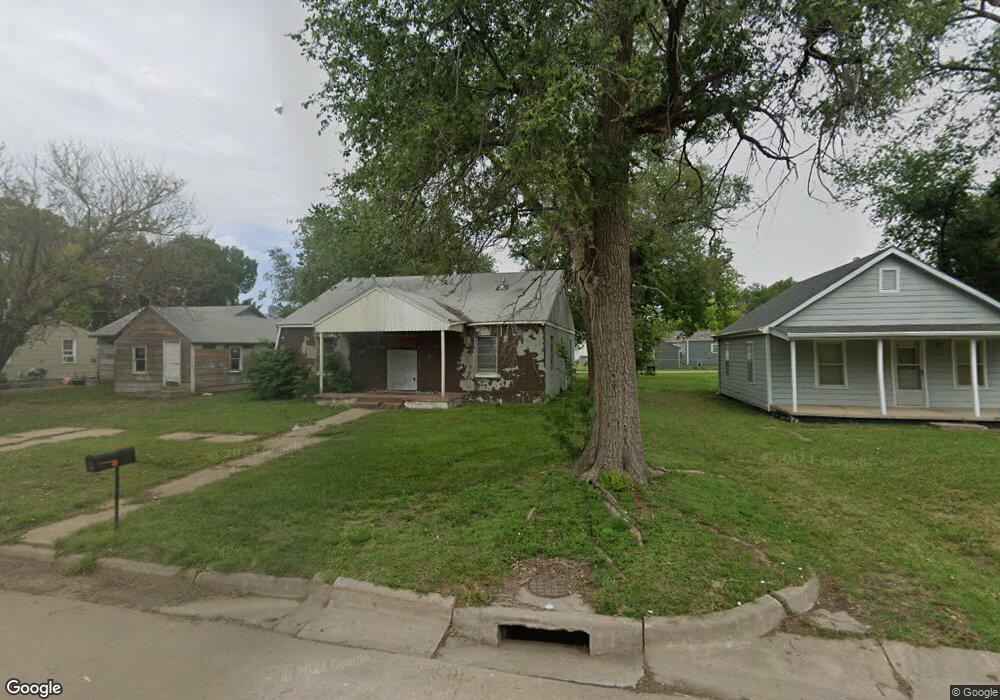
616 N 12th St Salina, KS 67401
Estimated Value: $53,294 - $129,000
2
Beds
2
Baths
1,296
Sq Ft
$65/Sq Ft
Est. Value
About This Home
This home is located at 616 N 12th St, Salina, KS 67401 and is currently estimated at $83,765, approximately $64 per square foot. 616 N 12th St is a home located in Saline County with nearby schools including Oakdale Elementary School, Lakewood Middle School, and Salina High School Central.
Ownership History
Date
Name
Owned For
Owner Type
Purchase Details
Closed on
Jan 4, 2023
Sold by
Salina Rental Incorporated
Bought by
Campus House Llc
Current Estimated Value
Purchase Details
Closed on
Jun 25, 2021
Sold by
Farril G Hawk T
Bought by
Salina Rentals Inc
Home Financials for this Owner
Home Financials are based on the most recent Mortgage that was taken out on this home.
Original Mortgage
$16,875
Interest Rate
2.9%
Mortgage Type
Commercial
Create a Home Valuation Report for This Property
The Home Valuation Report is an in-depth analysis detailing your home's value as well as a comparison with similar homes in the area
Home Values in the Area
Average Home Value in this Area
Purchase History
| Date | Buyer | Sale Price | Title Company |
|---|---|---|---|
| Campus House Llc | -- | Mid Kansas Title | |
| Salina Rentals Inc | -- | Misc Company |
Source: Public Records
Mortgage History
| Date | Status | Borrower | Loan Amount |
|---|---|---|---|
| Previous Owner | Salina Rentals Inc | $16,875 |
Source: Public Records
Tax History Compared to Growth
Tax History
| Year | Tax Paid | Tax Assessment Tax Assessment Total Assessment is a certain percentage of the fair market value that is determined by local assessors to be the total taxable value of land and additions on the property. | Land | Improvement |
|---|---|---|---|---|
| 2025 | $156 | $1,990 | $619 | $1,371 |
| 2024 | $156 | $1,311 | $536 | $775 |
| 2023 | $156 | $2,173 | $562 | $1,611 |
| 2022 | $356 | $1,725 | $897 | $828 |
| 2021 | $305 | $2,530 | $592 | $1,938 |
| 2020 | $299 | $2,461 | $565 | $1,896 |
| 2019 | $138 | $2,300 | $595 | $1,705 |
| 2018 | $252 | $2,128 | $595 | $1,533 |
| 2017 | $0 | $2,242 | $622 | $1,620 |
| 2016 | $0 | $2,449 | $622 | $1,827 |
| 2015 | -- | $3,709 | $595 | $3,114 |
| 2013 | -- | $0 | $0 | $0 |
Source: Public Records
Map
Nearby Homes