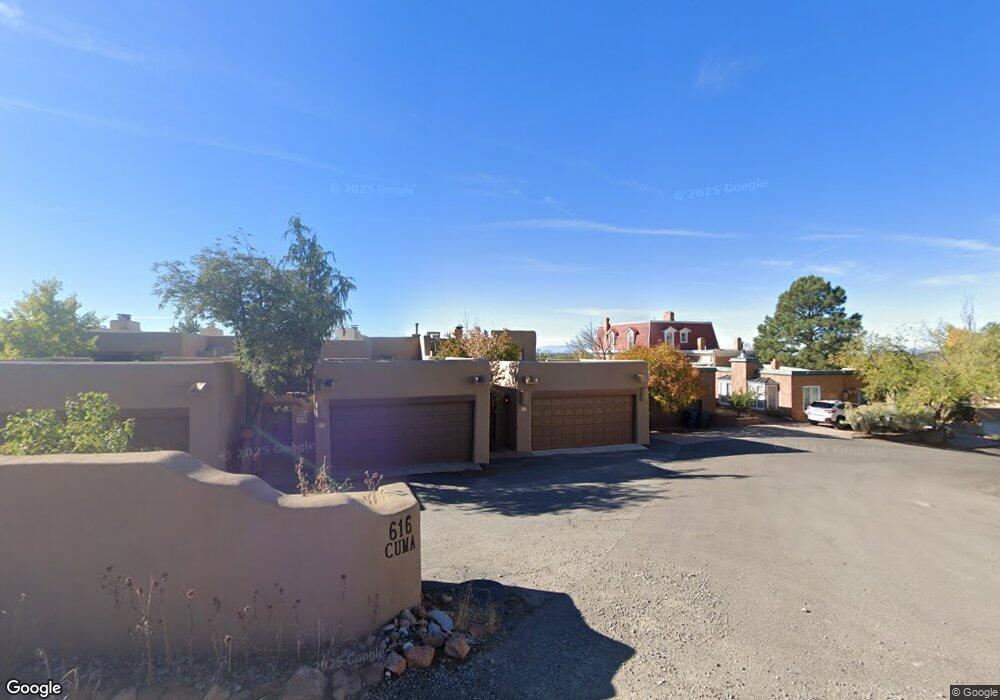
616 Paseo de La Cuma Santa Fe, NM 87501
Historic Saint Catherine's NeighborhoodEstimated Value: $872,000 - $1,043,431
1
Bed
2
Baths
2,112
Sq Ft
$450/Sq Ft
Est. Value
About This Home
This home is located at 616 Paseo de La Cuma, Santa Fe, NM 87501 and is currently estimated at $950,358, approximately $449 per square foot. 616 Paseo de La Cuma is a home located in Santa Fe County with nearby schools including Carlos Gilbert Elementary School, Santa Fe High School, and New Mexico School for the Arts.
Ownership History
Date
Name
Owned For
Owner Type
Purchase Details
Closed on
Mar 10, 2018
Sold by
Chase David D and Chase Katherine L
Bought by
Coleman William E and Coleman Kathleen P
Current Estimated Value
Home Financials for this Owner
Home Financials are based on the most recent Mortgage that was taken out on this home.
Original Mortgage
$840,000
Outstanding Balance
$718,787
Interest Rate
4.32%
Mortgage Type
Commercial
Estimated Equity
$231,571
Purchase Details
Closed on
Jan 24, 2014
Sold by
Powell Michael D and Glosser Gayle A
Bought by
Michael D Powell Revocable Trust and Glosser Gayle A
Purchase Details
Closed on
Apr 6, 1998
Sold by
Lovelace Frances Roe
Bought by
Powell Michael D and Glosser Gayle A
Home Financials for this Owner
Home Financials are based on the most recent Mortgage that was taken out on this home.
Original Mortgage
$280,000
Interest Rate
7.17%
Create a Home Valuation Report for This Property
The Home Valuation Report is an in-depth analysis detailing your home's value as well as a comparison with similar homes in the area
Home Values in the Area
Average Home Value in this Area
Purchase History
| Date | Buyer | Sale Price | Title Company |
|---|---|---|---|
| Coleman William E | -- | Prima Title Llc | |
| Michael D Powell Revocable Trust | -- | None Available | |
| Powell Michael D | -- | Southwestern Title & Escrow |
Source: Public Records
Mortgage History
| Date | Status | Borrower | Loan Amount |
|---|---|---|---|
| Open | Coleman William E | $840,000 | |
| Previous Owner | Powell Michael D | $280,000 |
Source: Public Records
Tax History Compared to Growth
Tax History
| Year | Tax Paid | Tax Assessment Tax Assessment Total Assessment is a certain percentage of the fair market value that is determined by local assessors to be the total taxable value of land and additions on the property. | Land | Improvement |
|---|---|---|---|---|
| 2024 | $5,322 | $698,387 | -- | $698,387 |
| 2023 | $5,322 | $678,046 | $0 | $678,046 |
| 2022 | $5,204 | $658,298 | $0 | $658,298 |
| 2021 | $5,124 | $213,042 | $0 | $213,042 |
| 2020 | $4,970 | $206,837 | $0 | $206,837 |
| 2019 | $4,901 | $200,812 | $0 | $200,812 |
| 2018 | $4,793 | $194,964 | $0 | $194,964 |
| 2017 | $4,673 | $189,285 | $0 | $189,285 |
| 2016 | $4,406 | $183,772 | $0 | $183,772 |
| 2015 | $4,255 | $178,420 | $0 | $178,420 |
| 2014 | $3,394 | $147,109 | $0 | $147,109 |
Source: Public Records
Map
Nearby Homes
- 563 Del Norte Ln
- 103 Catron St Unit 62H
- 103 Catron St Unit 60-C
- 103 Catron St Unit 48B
- 103 Catron St Unit 54A
- 103 Catron St Unit 49H
- 103 Catron St Unit 48 E
- 103 Catron St Unit 60-B
- 103 Catron St Unit 61B
- 103 Catron St Unit 48C
- 103 Catron Street 1 8 Share Unit 53G
- 1 Paseo de Peralta Unit A+B
- 104 Camino Matias Unit Lot 29
- 333 Magdalena Rd
- 304 Alegre St
- 220 1/2 Mckenzie St
- 604 Griffin St
- 334 Otero St Unit 12-1
- 334 Otero St Unit 12-3
- 334 Otero St Unit 11-4
- 616 Paseo de La Cuma Unit D
- 616 Paseo de La Cuma
- 616 Paseo de La Cuma
- 616 Paseo de La Cuma Unit E
- 616 Paseo de La Cuma Unit B
- 616 Paseo de La Cuma
- 624 Paseo de La Cuma #9
- 610 Paseo de La Cuma
- 610 Paseo de La Cuma Unit A
- 624 Paseo de La Cuma
- 624 Paseo de La Cuma Unit 11
- 624 Paseo de La Cuma Unit 10
- 624 Paseo de La Cuma
- 624 Paseo de La Cuma
- 624 Paseo de La Cuma
- 624 Paseo de La Cuma
- 624 Paseo de La Cuma
- 624 Paseo de La Cuma
- 624 Paseo de La Cuma
- 624 Paseo de La Cuma