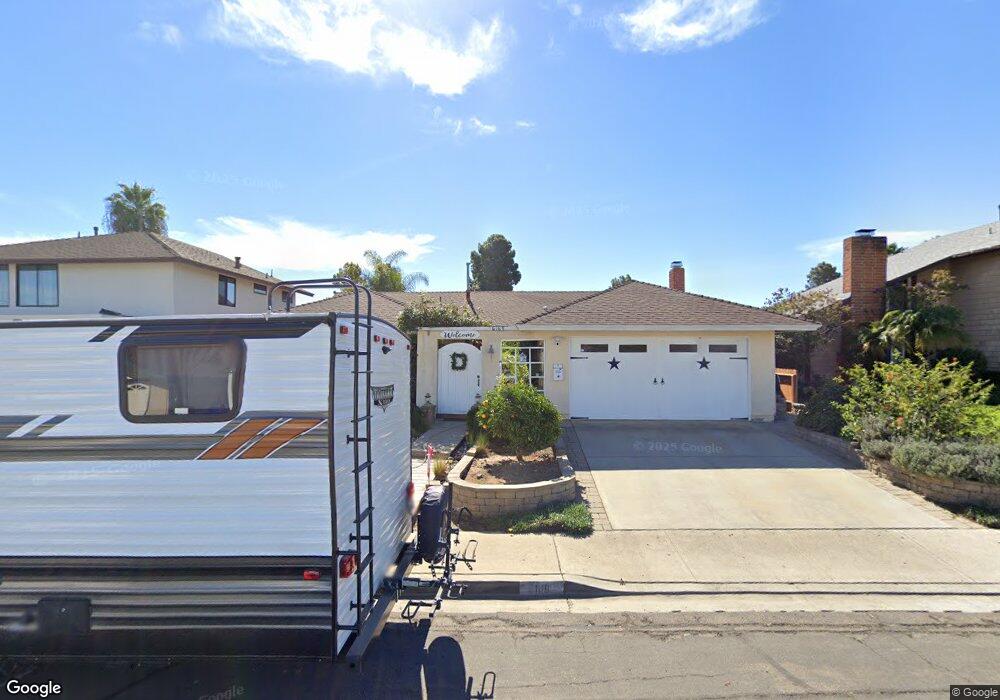
6169 Redbrook Rd San Diego, CA 92117
Clairemont Mesa East NeighborhoodEstimated Value: $1,099,487 - $1,392,000
4
Beds
2
Baths
1,619
Sq Ft
$742/Sq Ft
Est. Value
About This Home
This home is located at 6169 Redbrook Rd, San Diego, CA 92117 and is currently estimated at $1,201,622, approximately $742 per square foot. 6169 Redbrook Rd is a home located in San Diego County with nearby schools including Lafayette Elementary, Innovation Middle School, and Madison High School.
Ownership History
Date
Name
Owned For
Owner Type
Purchase Details
Closed on
Jul 21, 2017
Sold by
Devine Edward and Devine Theresa L
Bought by
Devine Edward and Devine Theresa L
Current Estimated Value
Home Financials for this Owner
Home Financials are based on the most recent Mortgage that was taken out on this home.
Original Mortgage
$482,000
Outstanding Balance
$400,680
Interest Rate
3.91%
Mortgage Type
New Conventional
Estimated Equity
$800,942
Purchase Details
Closed on
Apr 7, 2006
Sold by
Meslin Pete and Meslin Jan Nelson
Bought by
Devine Edward and Hart Theresa
Home Financials for this Owner
Home Financials are based on the most recent Mortgage that was taken out on this home.
Original Mortgage
$96,000
Interest Rate
5.95%
Mortgage Type
Stand Alone Second
Purchase Details
Closed on
May 27, 1988
Purchase Details
Closed on
Apr 27, 1988
Purchase Details
Closed on
Nov 22, 1985
Create a Home Valuation Report for This Property
The Home Valuation Report is an in-depth analysis detailing your home's value as well as a comparison with similar homes in the area
Home Values in the Area
Average Home Value in this Area
Purchase History
| Date | Buyer | Sale Price | Title Company |
|---|---|---|---|
| Devine Edward | -- | Ticor Title San Diego | |
| Devine Edward | $570,000 | New Century Title Company | |
| -- | $160,500 | -- | |
| -- | $161,800 | -- | |
| -- | $100,000 | -- |
Source: Public Records
Mortgage History
| Date | Status | Borrower | Loan Amount |
|---|---|---|---|
| Open | Devine Edward | $482,000 | |
| Closed | Devine Edward | $96,000 | |
| Closed | Devine Edward | $417,000 |
Source: Public Records
Tax History Compared to Growth
Tax History
| Year | Tax Paid | Tax Assessment Tax Assessment Total Assessment is a certain percentage of the fair market value that is determined by local assessors to be the total taxable value of land and additions on the property. | Land | Improvement |
|---|---|---|---|---|
| 2025 | $9,327 | $778,892 | $614,916 | $163,976 |
| 2024 | $9,327 | $763,620 | $602,859 | $160,761 |
| 2023 | $9,119 | $748,648 | $591,039 | $157,609 |
| 2022 | $8,875 | $733,969 | $579,450 | $154,519 |
| 2021 | $8,813 | $719,579 | $568,089 | $151,490 |
| 2020 | $8,248 | $675,000 | $532,000 | $143,000 |
| 2019 | $8,078 | $660,000 | $521,000 | $139,000 |
| 2018 | $6,998 | $600,000 | $474,000 | $126,000 |
| 2017 | $6,617 | $570,000 | $451,000 | $119,000 |
| 2016 | $6,054 | $520,000 | $412,000 | $108,000 |
| 2015 | $5,527 | $475,000 | $377,000 | $98,000 |
| 2014 | $5,135 | $440,000 | $350,000 | $90,000 |
Source: Public Records
Map
Nearby Homes
- 5656 Chandler Dr
- 5768 Camber Dr
- 5715 Castleton Dr
- 5783 Camber Dr
- 4410 Charger Blvd
- 4261 Cannington Dr
- 6750 Beadnell Way Unit 3
- 6602 Beadnell Way Unit 13
- 6666 Beadnell Way Unit 9
- 6666 Beadnell Way Unit 15
- 6939 Bettyhill Dr
- 6460 Convoy Ct Unit SPC 59
- 6460 Convoy Ct Unit 185
- 6460 Convoy Ct Unit SPC 318
- 5404 Balboa Arms Dr Unit 461
- 5402 Balboa Arms Dr Unit 345
- 6333 Mount Ada Rd Unit 278
- 6333 Mount Ada Rd Unit 258
- 6333 Mount Ada Rd Unit 156
- 6333 Mount Ada Rd Unit 183
- 6125 Redbrook Rd
- 6199 Redbrook Rd
- 6166 Printwood Way
- 6190 Printwood Way
- 6122 Printwood Way
- 6091 Redbrook Rd
- 6170 Redbrook Rd
- 6090 Printwood Way
- 6130 Redbrook Rd
- 6198 Redbrook Rd
- 6063 Redbrook Rd
- 6090 Redbrook Rd
- 4733 Printwood Ct
- 4727 Printwood Ct
- 6066 Printwood Way
- 4739 Printwood Ct
- 4721 Printwood Ct
- 4755 Redbrook Ct
- 4754 Printwood Ct
- 4745 Printwood Ct