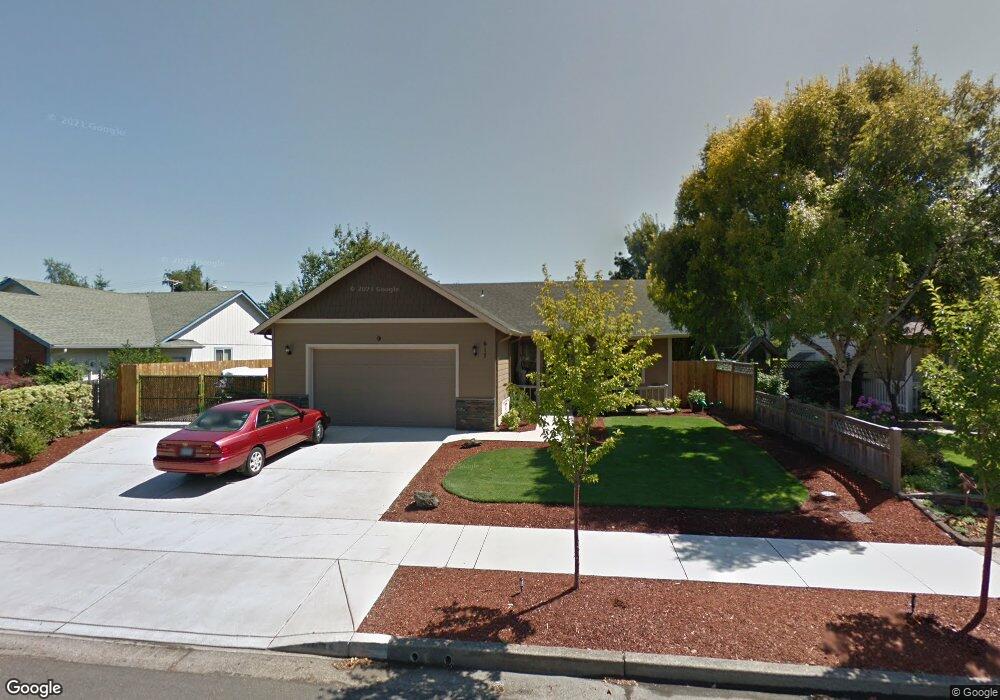
617 68th Place Springfield, OR 97478
Thurston NeighborhoodEstimated Value: $477,977 - $505,000
3
Beds
2
Baths
1,623
Sq Ft
$300/Sq Ft
Est. Value
About This Home
This home is located at 617 68th Place, Springfield, OR 97478 and is currently estimated at $486,994, approximately $300 per square foot. 617 68th Place is a home located in Lane County with nearby schools including Ridgeview Elementary School, Thurston Middle School, and Thurston High School.
Ownership History
Date
Name
Owned For
Owner Type
Purchase Details
Closed on
May 25, 2010
Sold by
Konold Gary
Bought by
Mckay Jason C and Mckay Sharlene
Current Estimated Value
Home Financials for this Owner
Home Financials are based on the most recent Mortgage that was taken out on this home.
Original Mortgage
$224,847
Outstanding Balance
$153,417
Interest Rate
5.5%
Mortgage Type
FHA
Estimated Equity
$333,577
Purchase Details
Closed on
Jan 4, 2010
Sold by
Gray James R and Gray Elizabeth Herrera
Bought by
Konold Gary
Create a Home Valuation Report for This Property
The Home Valuation Report is an in-depth analysis detailing your home's value as well as a comparison with similar homes in the area
Home Values in the Area
Average Home Value in this Area
Purchase History
| Date | Buyer | Sale Price | Title Company |
|---|---|---|---|
| Mckay Jason C | $249,900 | Cascade Title Co | |
| Konold Gary | $68,000 | Cascade Title Co |
Source: Public Records
Mortgage History
| Date | Status | Borrower | Loan Amount |
|---|---|---|---|
| Open | Mckay Jason C | $224,847 |
Source: Public Records
Tax History
| Year | Tax Paid | Tax Assessment Tax Assessment Total Assessment is a certain percentage of the fair market value that is determined by local assessors to be the total taxable value of land and additions on the property. | Land | Improvement |
|---|---|---|---|---|
| 2025 | $4,669 | $254,616 | -- | -- |
| 2024 | $4,593 | $247,200 | -- | -- |
| 2023 | $4,593 | $240,000 | $0 | $0 |
| 2022 | $4,254 | $233,010 | $0 | $0 |
| 2021 | $4,178 | $226,224 | $0 | $0 |
| 2020 | $4,056 | $219,635 | $0 | $0 |
| 2019 | $3,934 | $213,238 | $0 | $0 |
| 2018 | $3,708 | $200,998 | $0 | $0 |
| 2017 | $3,566 | $200,998 | $0 | $0 |
| 2016 | $3,491 | $195,144 | $0 | $0 |
| 2015 | $3,391 | $189,460 | $0 | $0 |
| 2014 | $3,340 | $183,942 | $0 | $0 |
Source: Public Records
Map
Nearby Homes
- 0 71st St
- 6898 Thurston Rd
- 6875 B St
- 353 71st St
- 7080 Thurston Rd Unit 2
- 0 Omlid Dr Unit 1 706471345
- 0 Omlid Dr Unit 11
- 0 Omlid Dr Unit 27 796722689
- 0 Omlid Dr Unit 26 256458253
- 0 Omlid Dr Unit 10
- 0 Omlid Dr Unit 3 154724851
- 0 Omlid Dr Unit 2 312357104
- 250 68th St
- 555 66th St
- 246 S 70th St
- 6540 B St
- 6964 Bluebelle Way
- 6445 B St
- 7027 S E St
- 616 S 71st St
- 629 68th Place
- 605 68th Place
- 651 68th Place
- 591 68th Place
- 6841 E Ct
- 602 68th Place
- 588 Laksonen Loop
- 588 68th Place
- 656 Laksonen Loop
- 673 68th Place
- 573 68th Place
- 550 Laksonen Loop
- 658 68th Place
- 662 Laksonen Loop
- 6829 E Ct
- 538 Laksonen Loop
- 564 68th Place
- 674 68th Place
- 6846 E St
- 674 Laksonen Loop
Your Personal Tour Guide
Ask me questions while you tour the home.