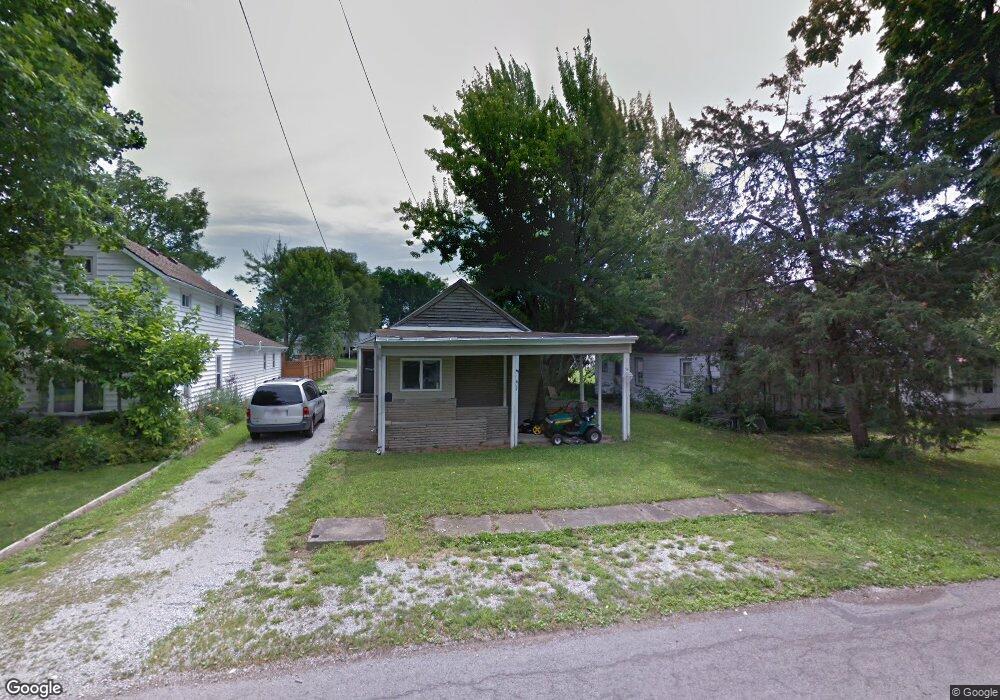
617 Henry St Kenton, OH 43326
Estimated Value: $96,417 - $140,000
3
Beds
1
Bath
1,117
Sq Ft
$105/Sq Ft
Est. Value
About This Home
This home is located at 617 Henry St, Kenton, OH 43326 and is currently estimated at $117,104, approximately $104 per square foot. 617 Henry St is a home located in Hardin County with nearby schools including Kenton Elementary School, Kenton Middle School, and Kenton High School.
Ownership History
Date
Name
Owned For
Owner Type
Purchase Details
Closed on
Aug 19, 2019
Sold by
Estate Of David Lee Manns
Bought by
Manns Kimberly L
Current Estimated Value
Purchase Details
Closed on
Mar 7, 2014
Sold by
Manns Delmar and Manns Janet
Bought by
Manns David L and Manns Kimberly L
Purchase Details
Closed on
Jan 2, 2014
Sold by
Manns Dean Q
Bought by
Manns Delmar and Manns Janet
Purchase Details
Closed on
Nov 27, 2012
Sold by
Manns Delmar and Manns Janet L
Bought by
Manns Dean Q
Purchase Details
Closed on
Jun 28, 2007
Sold by
Manns Delmar and Manns Janet L
Bought by
Manns Delmar and Manns Janet L
Purchase Details
Closed on
May 14, 2007
Sold by
Wm Specialty Mortgage Llc
Bought by
Reo Nationwide Llc
Purchase Details
Closed on
Sep 14, 2006
Sold by
Hinkle Nancy Marie and Hinkle Melvin Ernest
Bought by
Wm Specialty Mortgage Llc
Purchase Details
Closed on
Jan 26, 2000
Bought by
Hinkle Melvin Ernest
Create a Home Valuation Report for This Property
The Home Valuation Report is an in-depth analysis detailing your home's value as well as a comparison with similar homes in the area
Home Values in the Area
Average Home Value in this Area
Purchase History
| Date | Buyer | Sale Price | Title Company |
|---|---|---|---|
| Manns Kimberly L | -- | None Available | |
| Manns David L | $20,000 | None Available | |
| Manns Delmar | -- | None Available | |
| Manns Dean Q | -- | None Available | |
| Manns Delmar | -- | None Available | |
| Reo Nationwide Llc | $3,000 | None Available | |
| Wm Specialty Mortgage Llc | $9,000 | None Available | |
| Hinkle Melvin Ernest | $26,900 | -- |
Source: Public Records
Tax History Compared to Growth
Tax History
| Year | Tax Paid | Tax Assessment Tax Assessment Total Assessment is a certain percentage of the fair market value that is determined by local assessors to be the total taxable value of land and additions on the property. | Land | Improvement |
|---|---|---|---|---|
| 2024 | $749 | $16,560 | $1,980 | $14,580 |
| 2023 | $749 | $16,560 | $1,980 | $14,580 |
| 2022 | $521 | $10,700 | $1,740 | $8,960 |
| 2021 | $522 | $10,700 | $1,740 | $8,960 |
| 2020 | $486 | $10,700 | $1,740 | $8,960 |
| 2019 | $382 | $9,170 | $1,660 | $7,510 |
| 2018 | $382 | $9,170 | $1,660 | $7,510 |
| 2017 | $423 | $9,170 | $1,660 | $7,510 |
| 2016 | $469 | $12,100 | $2,290 | $9,810 |
| 2015 | $448 | $12,100 | $2,290 | $9,810 |
| 2014 | $304 | $15,320 | $2,290 | $13,030 |
| 2013 | $385 | $16,350 | $2,290 | $14,060 |
Source: Public Records
Map
Nearby Homes