Estimated Value: $619,000 - $783,000
3
Beds
2
Baths
1,487
Sq Ft
$495/Sq Ft
Est. Value
About This Home
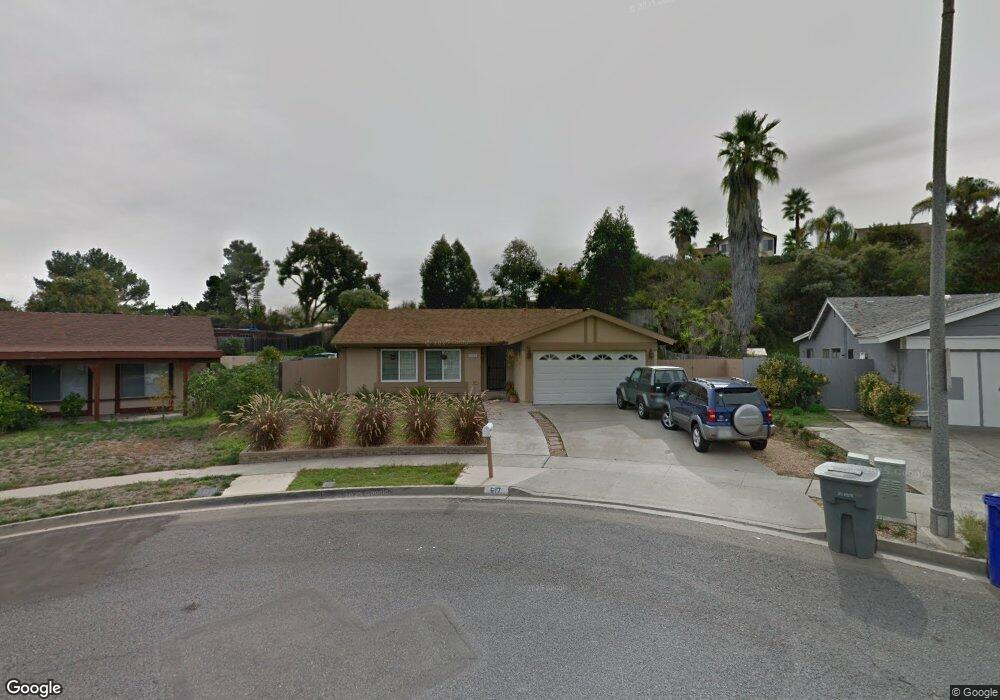
This home is located at 617 Lynnette Cir, Vista, CA 92084 and is currently estimated at $735,565, approximately $494 per square foot. 617 Lynnette Cir is a home located in San Diego County with nearby schools including Bobier Elementary School, Rancho Minerva Middle School, and Vista High School.
Ownership History
Date
Name
Owned For
Owner Type
Purchase Details
Closed on
Apr 15, 2021
Sold by
Sinatra Brian P
Bought by
Sinatra Brian Patrick and Sinatra Elizabeth Marcella
Current Estimated Value
Home Financials for this Owner
Home Financials are based on the most recent Mortgage that was taken out on this home.
Original Mortgage
$130,000
Outstanding Balance
$117,374
Interest Rate
3%
Mortgage Type
New Conventional
Estimated Equity
$618,191
Purchase Details
Closed on
Dec 21, 2020
Sold by
Sinatra William Michael
Bought by
Sinatra Brian Patrick and Sinatra Elizabeth Marcella
Purchase Details
Closed on
Oct 9, 2020
Sold by
Sinatra Family Trust and Sinatra Joseph
Bought by
Sinatra William Michael and Sinatra Brian P
Purchase Details
Closed on
Dec 12, 2007
Sold by
Sinatra William James and Sinatra Rita L
Bought by
Sinatra William James and Sinatra Rita L
Create a Home Valuation Report for This Property
The Home Valuation Report is an in-depth analysis detailing your home's value as well as a comparison with similar homes in the area
Purchase History
| Date | Buyer | Sale Price | Title Company |
|---|---|---|---|
| Sinatra Brian Patrick | -- | California Members Title Co | |
| Sinatra Brian Patrick | $267,500 | None Available | |
| Sinatra William Michael | -- | None Listed On Document | |
| Sinatra William James | -- | None Available |
Source: Public Records
Mortgage History
| Date | Status | Borrower | Loan Amount |
|---|---|---|---|
| Open | Sinatra Brian Patrick | $130,000 |
Source: Public Records
Tax History
| Year | Tax Paid | Tax Assessment Tax Assessment Total Assessment is a certain percentage of the fair market value that is determined by local assessors to be the total taxable value of land and additions on the property. | Land | Improvement |
|---|---|---|---|---|
| 2025 | $3,574 | $334,006 | $223,863 | $110,143 |
| 2024 | $3,574 | $327,458 | $219,474 | $107,984 |
| 2023 | $3,488 | $321,038 | $215,171 | $105,867 |
| 2022 | $3,478 | $314,744 | $210,952 | $103,792 |
| 2021 | $718 | $57,146 | $13,632 | $43,514 |
| 2020 | $1,318 | $56,561 | $13,493 | $43,068 |
| 2019 | $1,303 | $55,453 | $13,229 | $42,224 |
| 2018 | $1,274 | $54,367 | $12,970 | $41,397 |
| 2017 | $1,262 | $53,302 | $12,716 | $40,586 |
| 2016 | $1,234 | $52,258 | $12,467 | $39,791 |
| 2015 | $1,221 | $51,474 | $12,280 | $39,194 |
| 2014 | $1,196 | $50,467 | $12,040 | $38,427 |
Source: Public Records
Map
Nearby Homes
- 1329 Clear Crest Cir
- 405 Joann Cir
- 1400 Market St
- 724 Nob Cir
- 727 Nob Cir
- 1501 Anza Ave Unit 39
- 1501 Anza Ave Unit 62
- 1501 Anza Ave Unit 54
- 1501 Anza Ave Unit 79
- 1010 E Bobier Dr Unit 12
- 1010 E Bobier Dr Unit 174
- 1010 E Bobier Dr Unit 112
- 1010 E Bobier Dr Unit 137
- 1010 E Bobier Dr Unit 204
- 1010 E Bobier Dr Unit 118
- 1010 E Bobier Dr Unit 179
- 1010 E Bobier Dr Unit Space 51
- 361 E Indian Rock Rd
- 1658 San Luis Rey Ave
- 1600 E Vista Way Unit 23
- 623 Lynnette Cir
- 611 Lynnette Cir
- 625 Lynnette Cir
- 605 Lynnette Cir
- 719 E Bobier Dr
- 723 E Bobier Dr
- 1346 Clear Crest Cir
- 620 Lynnette Cir
- 5 E Bobier Dr
- 2 E Bobier Dr
- 1348 Clear Crest Cir
- E E Bobier Dr
- 599 Lynnette Cir
- 628 Lynnette Cir
- 1350 Clear Crest Cir
- 731 E Bobier Dr
- 632 Lynnette Cir
- 595 Lynnette Cir
- 1352 Clear Crest Cir
- 1342 Clear Crest Cir
Your Personal Tour Guide
Ask me questions while you tour the home.