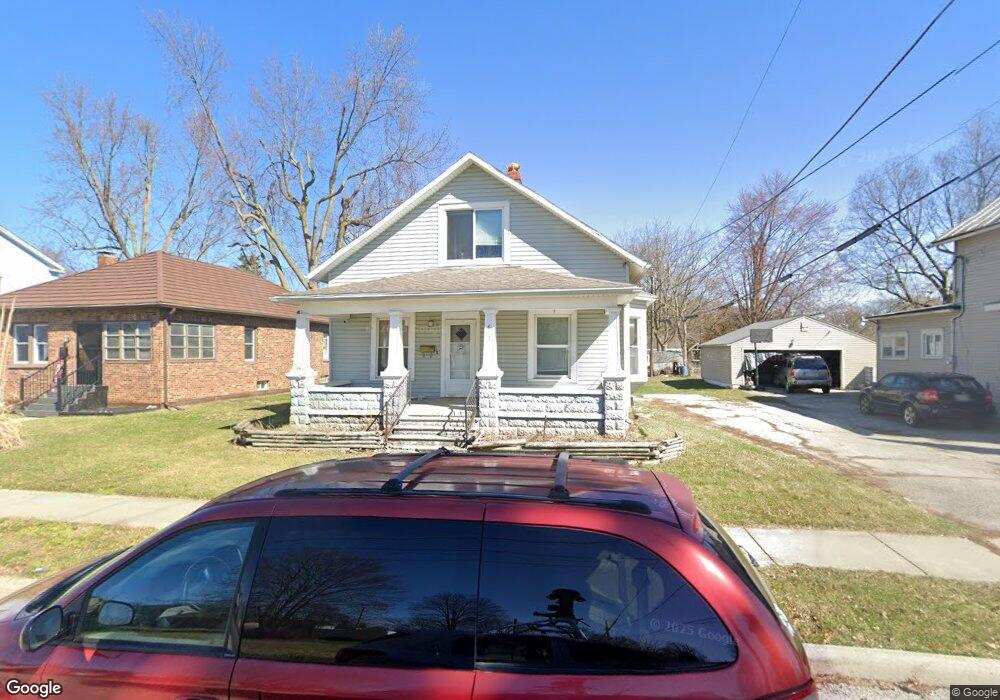
617 Morse St Findlay, OH 45840
Estimated Value: $129,000 - $157,196
3
Beds
1
Bath
1,077
Sq Ft
$135/Sq Ft
Est. Value
About This Home
This home is located at 617 Morse St, Findlay, OH 45840 and is currently estimated at $145,299, approximately $134 per square foot. 617 Morse St is a home located in Hancock County with nearby schools including Whittier Elementary School, Wilson Vance Elementary School, and Donnell Middle School.
Ownership History
Date
Name
Owned For
Owner Type
Purchase Details
Closed on
Mar 29, 2019
Sold by
Capponi Christine F
Bought by
Benson Christian
Current Estimated Value
Home Financials for this Owner
Home Financials are based on the most recent Mortgage that was taken out on this home.
Original Mortgage
$74,593
Outstanding Balance
$65,581
Interest Rate
4.3%
Mortgage Type
New Conventional
Estimated Equity
$79,718
Purchase Details
Closed on
Nov 4, 2004
Sold by
Fannie Mae
Bought by
Capponi Christine E and Schaull Scott B
Purchase Details
Closed on
Jun 21, 2004
Sold by
Luzader Randy J and Luzader Paula M
Bought by
Federal National Mortgage Association
Purchase Details
Closed on
Nov 8, 1991
Bought by
Luzader Randy J and Luzader Paula M
Purchase Details
Closed on
May 29, 1984
Bought by
Butcher John H and Butcher Joyce A
Purchase Details
Closed on
Mar 7, 1983
Bought by
Foltz Gail G
Create a Home Valuation Report for This Property
The Home Valuation Report is an in-depth analysis detailing your home's value as well as a comparison with similar homes in the area
Home Values in the Area
Average Home Value in this Area
Purchase History
| Date | Buyer | Sale Price | Title Company |
|---|---|---|---|
| Benson Christian | $76,900 | Godlen Key Title Agency | |
| Capponi Christine E | $62,500 | Louisville Title | |
| Federal National Mortgage Association | $57,000 | -- | |
| Luzader Randy J | $25,000 | -- | |
| Butcher John H | $18,000 | -- | |
| Foltz Gail G | -- | -- |
Source: Public Records
Mortgage History
| Date | Status | Borrower | Loan Amount |
|---|---|---|---|
| Open | Benson Christian | $74,593 |
Source: Public Records
Tax History Compared to Growth
Tax History
| Year | Tax Paid | Tax Assessment Tax Assessment Total Assessment is a certain percentage of the fair market value that is determined by local assessors to be the total taxable value of land and additions on the property. | Land | Improvement |
|---|---|---|---|---|
| 2024 | $1,346 | $37,890 | $5,680 | $32,210 |
| 2023 | $1,348 | $37,890 | $5,680 | $32,210 |
| 2022 | $1,343 | $37,890 | $5,680 | $32,210 |
| 2021 | $1,191 | $29,260 | $5,670 | $23,590 |
| 2020 | $1,191 | $29,260 | $5,670 | $23,590 |
| 2019 | $1,167 | $29,260 | $5,670 | $23,590 |
| 2018 | $1,070 | $23,940 | $5,160 | $18,780 |
| 2017 | $1,069 | $23,940 | $5,160 | $18,780 |
| 2016 | $1,064 | $23,940 | $5,160 | $18,780 |
| 2015 | $856 | $19,030 | $3,450 | $15,580 |
| 2014 | $856 | $19,030 | $3,450 | $15,580 |
| 2012 | $854 | $18,780 | $3,450 | $15,330 |
Source: Public Records
Map
Nearby Homes
- 820 Selby St
- 904 Morse St
- 15591 Canadian Way
- 15586 Canadian Way
- 15615 Canadian Way
- 817 Park St
- 210 Eastowne Park Row
- 1001 Decker Ave
- 619 Fishlock Ave
- 1109 Brookside Dr
- 420 1st St
- 545 Clinton Ct
- 309 Huron Rd
- 829 Maple Ave
- 1037 Fishlock Ave
- 1109 Park St
- 523 Center St
- 202 Hancock St
- 1802 Lippincott Ave
- 1301 Fishlock Ave