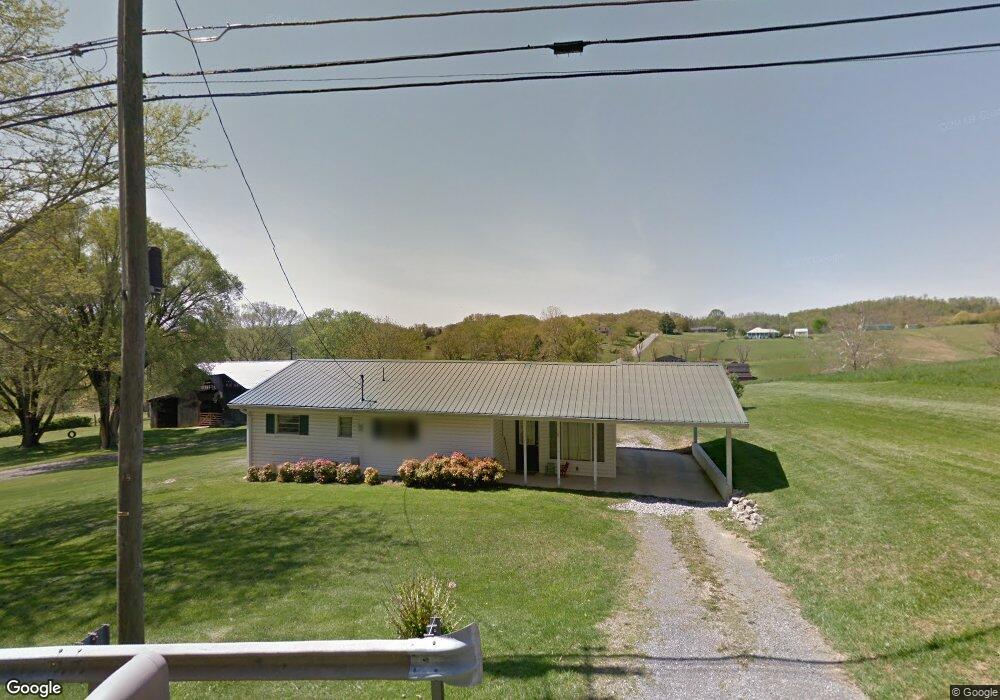
617 V I Ranch Rd Bristol, TN 37620
Estimated Value: $93,931 - $195,000
--
Bed
1
Bath
1,020
Sq Ft
$132/Sq Ft
Est. Value
About This Home
This home is located at 617 V I Ranch Rd, Bristol, TN 37620 and is currently estimated at $134,983, approximately $132 per square foot. 617 V I Ranch Rd is a home located in Sullivan County with nearby schools including Emmett Elementary School, Sullivan East Middle School, and Sullivan East High School.
Ownership History
Date
Name
Owned For
Owner Type
Purchase Details
Closed on
Aug 5, 2022
Sold by
Robert Seats Andrew
Bought by
Seats Andrew Robert
Current Estimated Value
Home Financials for this Owner
Home Financials are based on the most recent Mortgage that was taken out on this home.
Original Mortgage
$65,000
Outstanding Balance
$58,876
Interest Rate
5.3%
Mortgage Type
New Conventional
Estimated Equity
$76,107
Purchase Details
Closed on
Sep 30, 2011
Sold by
Seats Ward B
Bought by
Seats Matthew Bradley and Seats Christie
Home Financials for this Owner
Home Financials are based on the most recent Mortgage that was taken out on this home.
Original Mortgage
$50,000
Interest Rate
4.3%
Mortgage Type
Commercial
Purchase Details
Closed on
Sep 20, 2011
Sold by
Seats Ward B
Bought by
Seats Andrew Robert and Seats Maranda
Home Financials for this Owner
Home Financials are based on the most recent Mortgage that was taken out on this home.
Original Mortgage
$50,000
Interest Rate
4.3%
Mortgage Type
Commercial
Purchase Details
Closed on
Jan 10, 2001
Create a Home Valuation Report for This Property
The Home Valuation Report is an in-depth analysis detailing your home's value as well as a comparison with similar homes in the area
Home Values in the Area
Average Home Value in this Area
Purchase History
| Date | Buyer | Sale Price | Title Company |
|---|---|---|---|
| Seats Andrew Robert | -- | None Listed On Document | |
| Seats Matthew Bradley | $24,000 | -- | |
| Seats Andrew Robert | $50,000 | -- | |
| -- | $60,000 | -- |
Source: Public Records
Mortgage History
| Date | Status | Borrower | Loan Amount |
|---|---|---|---|
| Open | Seats Andrew Robert | $65,000 | |
| Previous Owner | Seats Andrew Robert | $50,000 |
Source: Public Records
Tax History Compared to Growth
Tax History
| Year | Tax Paid | Tax Assessment Tax Assessment Total Assessment is a certain percentage of the fair market value that is determined by local assessors to be the total taxable value of land and additions on the property. | Land | Improvement |
|---|---|---|---|---|
| 2024 | $414 | $16,600 | $3,550 | $13,050 |
| 2023 | $399 | $16,600 | $3,550 | $13,050 |
| 2022 | $399 | $16,600 | $3,550 | $13,050 |
| 2021 | $400 | $16,600 | $3,550 | $13,050 |
| 2020 | $397 | $16,625 | $3,550 | $13,075 |
| 2019 | $397 | $15,450 | $3,550 | $11,900 |
| 2018 | $394 | $15,450 | $3,550 | $11,900 |
| 2017 | $394 | $15,450 | $3,550 | $11,900 |
| 2016 | $319 | $12,375 | $3,575 | $8,800 |
| 2014 | $285 | $12,378 | $0 | $0 |
Source: Public Records
Map
Nearby Homes
- 518 V I Ranch Rd
- 1403 Bristol Caverns Hwy
- TBD Skyline Dr
- 158 Jones Hollow Rd
- 302 Roscommon Dr
- 1626 Paperville Rd
- 121 Queensgate
- 224 Galway Rd
- 141 Queensgate
- Tbd Kilcoote Way
- 6054 Old Jonesboro Rd
- 225 Duncan Ln
- 205 Donegal Way
- 120 Bear Hollow Rd
- 224 Brighton Place
- 215 Brighton Place
- 354 Monroe Dr
- 348 Monroe Dr
- 340 Monroe Dr
- 334 Monroe Dr
- 323 Springdale Dr
- 583 V I Ranch Rd
- 641 V I Ranch Rd
- TBD V I Ranch Rd
- 582 V I Ranch Rd
- 559 V I Ranch Rd
- 353 Springdale Dr
- 634 V I Ranch Rd
- 668 V I Ranch Rd
- 669 V I Ranch Rd
- 515 V I Ranch Rd
- 364 Springdale Dr
- 541 V I Ranch Rd
- 678 V I Ranch Rd
- 347 Springdale Dr
- 686 V I Ranch Rd
- 691 V I Ranch Rd
- 397 Springdale Dr
- 703 V I Ranch Rd
- 514 V I Ranch Rd