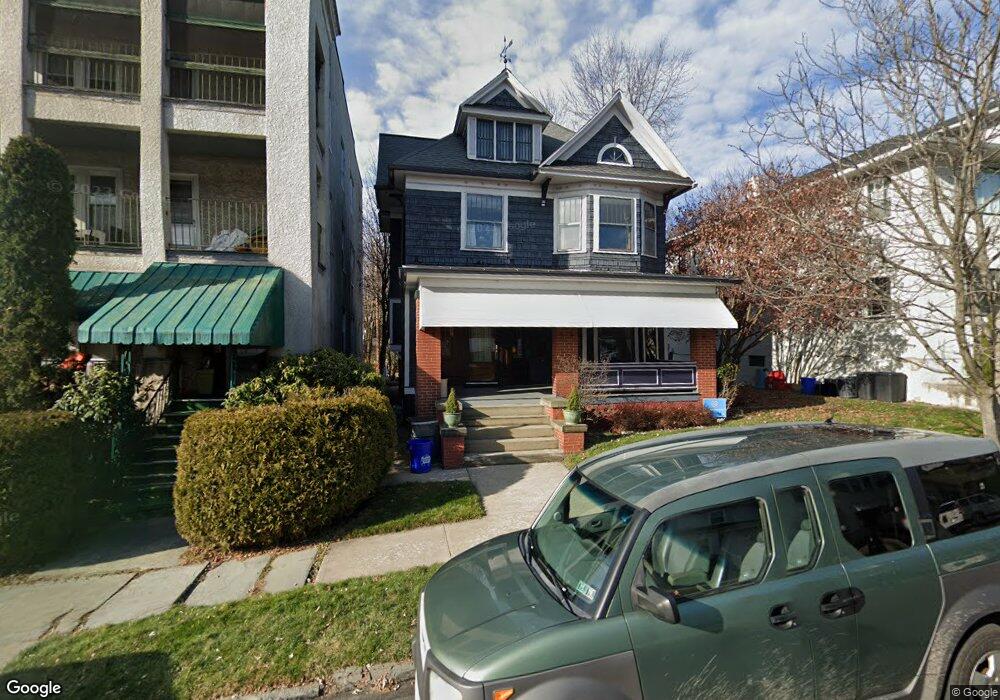
617 Wheeler Ave Unit L17 Scranton, PA 18510
Hill Section NeighborhoodEstimated Value: $154,867 - $222,000
4
Beds
1
Bath
1,770
Sq Ft
$107/Sq Ft
Est. Value
About This Home
This home is located at 617 Wheeler Ave Unit L17, Scranton, PA 18510 and is currently estimated at $189,967, approximately $107 per square foot. 617 Wheeler Ave Unit L17 is a home located in Lackawanna County with nearby schools including Lakeside Elementary School, Pinchbeck Elementary School, and Columbia Heights Elementary School.
Ownership History
Date
Name
Owned For
Owner Type
Purchase Details
Closed on
Aug 2, 2010
Sold by
Anania Peter and Anania Maureen
Bought by
Anania Peter and Anania Maureen
Current Estimated Value
Home Financials for this Owner
Home Financials are based on the most recent Mortgage that was taken out on this home.
Original Mortgage
$132,400
Outstanding Balance
$44,098
Interest Rate
4.44%
Mortgage Type
New Conventional
Estimated Equity
$145,869
Purchase Details
Closed on
Oct 24, 2005
Sold by
Harrity Simmone and Harrity Simmone D
Bought by
Anania Peter and Cohane Maureen
Home Financials for this Owner
Home Financials are based on the most recent Mortgage that was taken out on this home.
Original Mortgage
$103,550
Interest Rate
5.79%
Mortgage Type
New Conventional
Create a Home Valuation Report for This Property
The Home Valuation Report is an in-depth analysis detailing your home's value as well as a comparison with similar homes in the area
Home Values in the Area
Average Home Value in this Area
Purchase History
| Date | Buyer | Sale Price | Title Company |
|---|---|---|---|
| Anania Peter | -- | Titleserve National | |
| Anania Peter | $109,000 | None Available |
Source: Public Records
Mortgage History
| Date | Status | Borrower | Loan Amount |
|---|---|---|---|
| Open | Anania Peter | $132,400 | |
| Closed | Anania Peter | $103,550 |
Source: Public Records
Tax History Compared to Growth
Tax History
| Year | Tax Paid | Tax Assessment Tax Assessment Total Assessment is a certain percentage of the fair market value that is determined by local assessors to be the total taxable value of land and additions on the property. | Land | Improvement |
|---|---|---|---|---|
| 2025 | $3,543 | $10,000 | $3,250 | $6,750 |
| 2024 | $3,260 | $10,000 | $3,250 | $6,750 |
| 2023 | $3,260 | $10,000 | $3,250 | $6,750 |
| 2022 | $639 | $10,000 | $3,250 | $6,750 |
| 2021 | $3,189 | $10,000 | $3,250 | $6,750 |
| 2020 | $3,135 | $10,000 | $3,250 | $6,750 |
| 2019 | $2,956 | $10,000 | $3,250 | $6,750 |
| 2018 | $2,956 | $10,000 | $3,250 | $6,750 |
| 2017 | $2,909 | $10,000 | $3,250 | $6,750 |
| 2016 | $1,097 | $10,000 | $3,250 | $6,750 |
| 2015 | $1,914 | $10,000 | $3,250 | $6,750 |
| 2014 | -- | $10,000 | $3,250 | $6,750 |
Source: Public Records
Map
Nearby Homes
- 616-618 Harrison Ave
- 7 Oakwood Place
- 516 Harrison Ave
- 545 Prescott Ave
- 715 Prescott Ave Unit L17
- 0 Colfax Ave
- 1325 Olive St
- 0 Colfax and Gibson Ave Unit GSBSC255175
- 805-807 N Irving Ave
- 342 Harrison Ave
- 432 Taylor Ave
- 329 Prescott Ave
- 560 N Webster Ave
- 550 Clay Ave Unit 8c
- 316 Taylor Ave
- 228 Prescott Ave
- 621 Clay Ave
- 917 Taylor Ave
- 1406 Ash St
- 949 Taylor Ave
- 621 Wheeler Ave Unit 623
- 615 Wheeler Ave
- 621-623 Wheeler Ave
- 627 Wheeler Ave
- 605 Wheeler Ave Unit 607
- 629-631 Wheeler Ave
- 601 Wheeler Ave Unit 603
- 601 Rear Wheeler Ave
- 635 Wheeler Ave
- 1615 Olive St
- 601-603 Wheeler Ave
- 618 Wheeler Ave
- 614 Harrison Ave
- 614 Wheeler Ave
- 606 Harrison Ave
- 622 Wheeler Ave
- 622 Wheeler 1st Floor Ave
- 622 Wheeler Ave Unit 2nd Floor
- 622 Wheeler Ave Unit 1st Fl
- 1613 Olive St