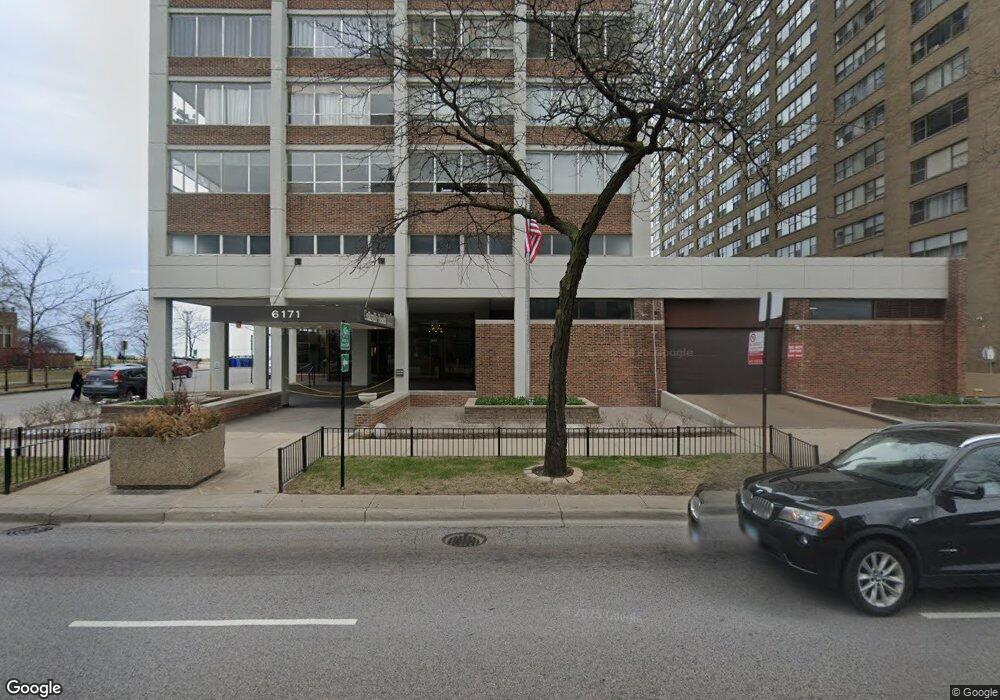
Granville Beach Condominiums 6171 N Sheridan Rd Unit 2612 Chicago, IL 60660
Edgewater NeighborhoodEstimated Value: $232,634 - $290,000
2
Beds
2
Baths
1,068
Sq Ft
$233/Sq Ft
Est. Value
About This Home
This home is located at 6171 N Sheridan Rd Unit 2612, Chicago, IL 60660 and is currently estimated at $248,409, approximately $232 per square foot. 6171 N Sheridan Rd Unit 2612 is a home located in Cook County with nearby schools including Senn High School, Sacred Heart Schools, and Northside Catholic Academy.
Ownership History
Date
Name
Owned For
Owner Type
Purchase Details
Closed on
May 16, 2008
Sold by
Bermudez Maximo C and Bermudez Teadora
Bought by
Mathur Jay B and Lazzerini Mathur Holly A
Current Estimated Value
Home Financials for this Owner
Home Financials are based on the most recent Mortgage that was taken out on this home.
Original Mortgage
$172,000
Outstanding Balance
$108,184
Interest Rate
5.75%
Mortgage Type
Purchase Money Mortgage
Estimated Equity
$140,225
Purchase Details
Closed on
Nov 30, 2001
Sold by
Bermudez Maximo C
Bought by
Bermudez Maximo C and Bermudez Teodora
Purchase Details
Closed on
Jun 18, 1996
Sold by
Cole Taylor Bank
Bought by
Bermudez Maximo C
Home Financials for this Owner
Home Financials are based on the most recent Mortgage that was taken out on this home.
Original Mortgage
$61,275
Interest Rate
7.87%
Create a Home Valuation Report for This Property
The Home Valuation Report is an in-depth analysis detailing your home's value as well as a comparison with similar homes in the area
Home Values in the Area
Average Home Value in this Area
Purchase History
| Date | Buyer | Sale Price | Title Company |
|---|---|---|---|
| Mathur Jay B | $215,000 | None Available | |
| Bermudez Maximo C | -- | Brokers Title Insurance Co | |
| Bermudez Maximo C | $64,500 | Attorneys Natl Title Network |
Source: Public Records
Mortgage History
| Date | Status | Borrower | Loan Amount |
|---|---|---|---|
| Open | Mathur Jay B | $172,000 | |
| Previous Owner | Bermudez Maximo C | $61,275 |
Source: Public Records
Tax History Compared to Growth
Tax History
| Year | Tax Paid | Tax Assessment Tax Assessment Total Assessment is a certain percentage of the fair market value that is determined by local assessors to be the total taxable value of land and additions on the property. | Land | Improvement |
|---|---|---|---|---|
| 2024 | $444 | $23,264 | $1,440 | $21,824 |
| 2023 | $447 | $18,879 | $1,114 | $17,765 |
| 2022 | $447 | $18,879 | $1,114 | $17,765 |
| 2021 | $426 | $18,878 | $1,114 | $17,764 |
| 2020 | $439 | $13,424 | $665 | $12,759 |
| 2019 | $438 | $14,852 | $665 | $14,187 |
| 2018 | $431 | $14,852 | $665 | $14,187 |
| 2017 | $462 | $11,298 | $578 | $10,720 |
| 2016 | $883 | $11,298 | $578 | $10,720 |
| 2015 | $1,590 | $11,298 | $578 | $10,720 |
| 2014 | $1,181 | $8,936 | $440 | $8,496 |
| 2013 | $1,147 | $8,936 | $440 | $8,496 |
Source: Public Records
About Granville Beach Condominiums
Map
Nearby Homes
- 6147 N Sheridan Rd Unit 7A
- 6145 N Sheridan Rd Unit 27A
- 6157 N Sheridan Rd Unit 5G
- 940 W Glenlake Ave Unit 19C
- 6171 N Sheridan Rd Unit 1102
- 6171 N Sheridan Rd Unit 1804
- 6171 N Sheridan Rd Unit 1408
- 6171 N Sheridan Rd Unit 402
- 6171 N Sheridan Rd Unit 1610
- 6101 N Sheridan Rd Unit 12E
- 6101 N Sheridan Rd Unit 1F
- 6118 N Sheridan Rd Unit 206
- 6118 N Sheridan Rd Unit 1003
- 6033 N Sheridan Rd Unit 18K
- 6033 N Sheridan Rd Unit 36G
- 6033 N Sheridan Rd Unit 40H
- 6033 N Sheridan Rd Unit 45L
- 6033 N Sheridan Rd Unit 7C
- 6033 N Sheridan Rd Unit 8E
- 6033 N Sheridan Rd Unit 37H
- 6171 N Sheridan Rd Unit 1907
- 6171 N Sheridan Rd Unit 1703
- 6171 N Sheridan Rd Unit 1605
- 6171 N Sheridan Rd Unit 1208
- 6171 N Sheridan Rd Unit 1606
- 6171 N Sheridan Rd Unit 1209
- 6171 N Sheridan Rd Unit 1312
- 6171 N Sheridan Rd Unit 2001
- 6171 N Sheridan Rd Unit 1301
- 6171 N Sheridan Rd Unit 1002
- 6171 N Sheridan Rd Unit 1707
- 6171 N Sheridan Rd Unit 1004
- 6171 N Sheridan Rd Unit 511
- 6171 N Sheridan Rd Unit 505
- 6171 N Sheridan Rd Unit 2603
- 6171 N Sheridan Rd Unit 2705
- 6171 N Sheridan Rd Unit 2710
- 6171 N Sheridan Rd Unit 1911
- 6171 N Sheridan Rd Unit 707