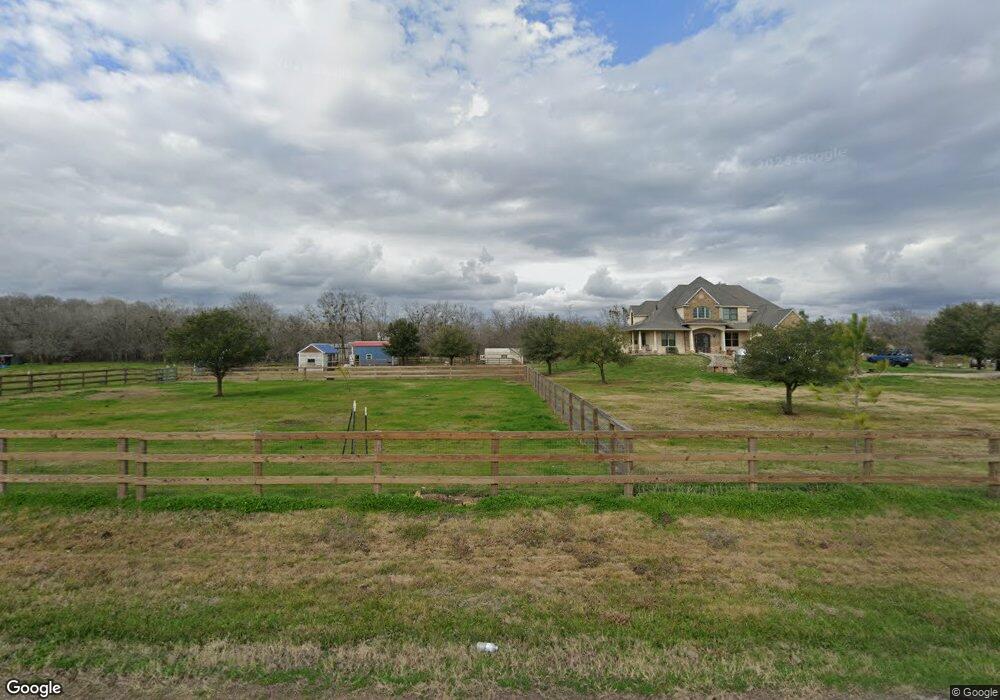
618 Perry St Rosenberg, TX 77471
Estimated Value: $612,000 - $1,226,623
6
Beds
5
Baths
4,464
Sq Ft
$206/Sq Ft
Est. Value
About This Home
This home is located at 618 Perry St, Rosenberg, TX 77471 and is currently estimated at $919,312, approximately $205 per square foot. 618 Perry St is a home located in Fort Bend County with nearby schools including Bentley Elementary School, Briscoe Junior High School, and Foster High School.
Ownership History
Date
Name
Owned For
Owner Type
Purchase Details
Closed on
Apr 21, 2014
Sold by
Hilliard Richard K and Hilliard Yun
Bought by
Druke Dominic C and Druke Jordayna J
Current Estimated Value
Home Financials for this Owner
Home Financials are based on the most recent Mortgage that was taken out on this home.
Original Mortgage
$552,000
Outstanding Balance
$419,939
Interest Rate
4.36%
Mortgage Type
New Conventional
Estimated Equity
$499,373
Purchase Details
Closed on
Aug 8, 2006
Sold by
Brown Cindy F
Bought by
Hilliard Richard K and Hilliard Yun
Home Financials for this Owner
Home Financials are based on the most recent Mortgage that was taken out on this home.
Original Mortgage
$119,180
Interest Rate
6.78%
Mortgage Type
Purchase Money Mortgage
Create a Home Valuation Report for This Property
The Home Valuation Report is an in-depth analysis detailing your home's value as well as a comparison with similar homes in the area
Home Values in the Area
Average Home Value in this Area
Purchase History
| Date | Buyer | Sale Price | Title Company |
|---|---|---|---|
| Druke Dominic C | -- | Startex Title 11 | |
| Hilliard Richard K | -- | Alamo Title Company | |
| Druke Dominic C | -- | -- |
Source: Public Records
Mortgage History
| Date | Status | Borrower | Loan Amount |
|---|---|---|---|
| Open | Druke Dominic C | $552,000 | |
| Previous Owner | Druke Dominic C | $119,180 |
Source: Public Records
Tax History
| Year | Tax Paid | Tax Assessment Tax Assessment Total Assessment is a certain percentage of the fair market value that is determined by local assessors to be the total taxable value of land and additions on the property. | Land | Improvement |
|---|---|---|---|---|
| 2025 | $11,000 | $899,239 | $47,538 | $857,304 |
| 2024 | $11,000 | $817,965 | $35,245 | $782,720 |
| 2023 | $10,934 | $805,033 | $36,363 | $768,670 |
| 2022 | $11,466 | $738,610 | $0 | $809,060 |
| 2021 | $11,380 | $671,460 | $160,320 | $511,140 |
| 2020 | $11,506 | $668,030 | $160,430 | $507,600 |
| 2019 | $13,508 | $728,560 | $160,320 | $568,240 |
| 2018 | $14,084 | $757,600 | $160,320 | $597,280 |
| 2017 | $12,838 | $688,730 | $160,320 | $528,410 |
| 2016 | $12,552 | $673,390 | $160,320 | $513,070 |
| 2015 | $11,717 | $678,240 | $156,660 | $521,580 |
| 2014 | $9,544 | $546,120 | $144,300 | $401,820 |
Source: Public Records
Map
Nearby Homes
- 1101 Baker Rd
- 1021 Mehrens Rd
- 00 Baker Rd
- 6410 Oxford Lake Dr
- 6027 Prince Place Dr
- 6007 Prince Place Dr
- 6014 Prince Place Dr
- 2019 Preston Park
- 503 Willow St
- 204 3rd St
- 6014 Watford Bend
- 2027 Wembley Way
- 0 Brazos St
- 0 Fm 723 Rd
- 401 2nd St
- 5922 Watford Bend
- 5919 Micah Ln
- 6111 Wickshire Dr
- 413 2nd St
- 5819 Watford Bend
Your Personal Tour Guide
Ask me questions while you tour the home.