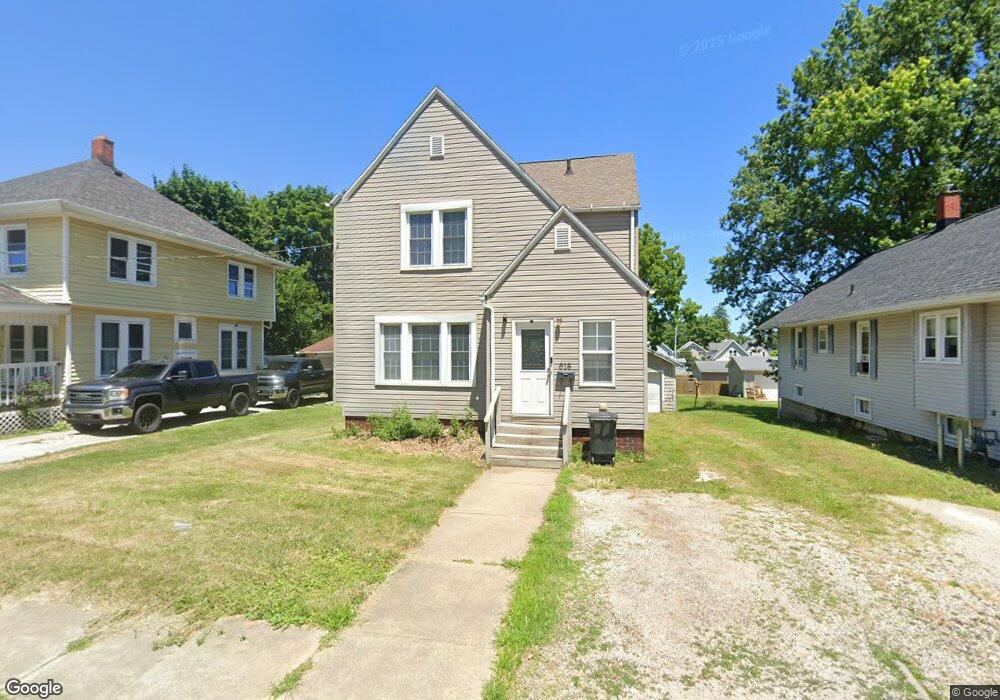
618 Vine St Ashland, OH 44805
Estimated Value: $144,000 - $156,000
3
Beds
2
Baths
1,290
Sq Ft
$117/Sq Ft
Est. Value
About This Home
This home is located at 618 Vine St, Ashland, OH 44805 and is currently estimated at $151,227, approximately $117 per square foot. 618 Vine St is a home located in Ashland County with nearby schools including Ashland High School, Ashland County Community Academy, and St. Edward Elementary School.
Ownership History
Date
Name
Owned For
Owner Type
Purchase Details
Closed on
Jan 6, 2022
Sold by
Ashland Sf Housing Llc
Bought by
Alf Properties Llc
Current Estimated Value
Home Financials for this Owner
Home Financials are based on the most recent Mortgage that was taken out on this home.
Original Mortgage
$585,600
Outstanding Balance
$368,270
Interest Rate
3.12%
Mortgage Type
New Conventional
Estimated Equity
-$217,043
Purchase Details
Closed on
Feb 20, 2019
Sold by
Heartland Estates Llc
Bought by
Ashland Sf Housing Llc
Purchase Details
Closed on
Feb 12, 2015
Bought by
Heartland Estates Llc
Purchase Details
Closed on
Mar 25, 2003
Bought by
Calame Joshua A
Purchase Details
Closed on
May 5, 2000
Sold by
Denny Timothy E
Purchase Details
Closed on
Dec 31, 1996
Sold by
Derr Robert P
Bought by
Denny Timothy E
Purchase Details
Closed on
Jun 13, 1975
Bought by
Derr Robert P
Create a Home Valuation Report for This Property
The Home Valuation Report is an in-depth analysis detailing your home's value as well as a comparison with similar homes in the area
Home Values in the Area
Average Home Value in this Area
Purchase History
| Date | Buyer | Sale Price | Title Company |
|---|---|---|---|
| Alf Properties Llc | -- | New Title Company Name | |
| Ashland Sf Housing Llc | $375 | Attorney Only | |
| Heartland Estates Llc | -- | -- | |
| Calame Joshua A | $50,000 | -- | |
| -- | $77,900 | -- | |
| Denny Timothy E | $68,900 | -- | |
| Derr Robert P | $24,000 | -- |
Source: Public Records
Mortgage History
| Date | Status | Borrower | Loan Amount |
|---|---|---|---|
| Open | Alf Properties Llc | $585,600 |
Source: Public Records
Tax History
| Year | Tax Paid | Tax Assessment Tax Assessment Total Assessment is a certain percentage of the fair market value that is determined by local assessors to be the total taxable value of land and additions on the property. | Land | Improvement |
|---|---|---|---|---|
| 2025 | $1,312 | $37,010 | $8,010 | $29,000 |
| 2024 | $1,312 | $37,010 | $8,010 | $29,000 |
| 2023 | $1,312 | $37,010 | $8,010 | $29,000 |
| 2022 | $1,229 | $27,410 | $5,930 | $21,480 |
| 2021 | $1,234 | $27,410 | $5,930 | $21,480 |
| 2020 | $1,170 | $27,410 | $5,930 | $21,480 |
| 2019 | $1,019 | $22,070 | $6,740 | $15,330 |
| 2018 | $1,027 | $22,070 | $6,740 | $15,330 |
| 2017 | $1,031 | $22,070 | $6,740 | $15,330 |
| 2016 | $979 | $20,060 | $6,130 | $13,930 |
| 2015 | $944 | $20,060 | $6,130 | $13,930 |
| 2013 | $1,150 | $22,890 | $6,050 | $16,840 |
Source: Public Records
Map
Nearby Homes
Your Personal Tour Guide
Ask me questions while you tour the home.