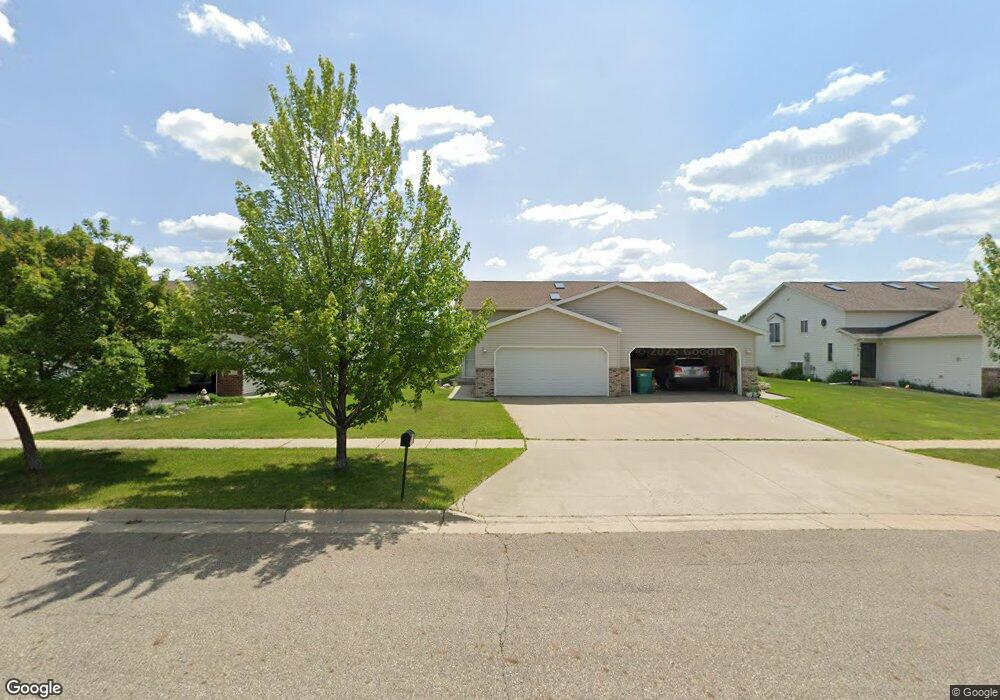
619 14th Ave E West Fargo, ND 58078
Charleswood NeighborhoodEstimated Value: $269,000 - $276,914
3
Beds
2
Baths
1,968
Sq Ft
$139/Sq Ft
Est. Value
About This Home
This home is located at 619 14th Ave E, West Fargo, ND 58078 and is currently estimated at $272,957, approximately $138 per square foot. 619 14th Ave E is a home located in Cass County with nearby schools including South Elementary School, Cheney Middle School, and West Fargo High School.
Ownership History
Date
Name
Owned For
Owner Type
Purchase Details
Closed on
Oct 14, 2021
Sold by
Hofer Paul and Hofer Tammy
Bought by
Keller Joshua S and Johnson Samantha L
Current Estimated Value
Home Financials for this Owner
Home Financials are based on the most recent Mortgage that was taken out on this home.
Original Mortgage
$214,370
Outstanding Balance
$192,922
Interest Rate
2.8%
Mortgage Type
New Conventional
Estimated Equity
$80,035
Purchase Details
Closed on
Aug 2, 2012
Sold by
Ista Susan M
Bought by
Hofer Paul and Hofer Tammy
Home Financials for this Owner
Home Financials are based on the most recent Mortgage that was taken out on this home.
Original Mortgage
$106,500
Interest Rate
3.65%
Mortgage Type
New Conventional
Purchase Details
Closed on
Jan 29, 2010
Sold by
Ista Eric R
Bought by
Ista Susan M
Create a Home Valuation Report for This Property
The Home Valuation Report is an in-depth analysis detailing your home's value as well as a comparison with similar homes in the area
Home Values in the Area
Average Home Value in this Area
Purchase History
We collect this data history from publicly available records. To have your information removed, we recommend requesting removal directly through your county’s website.
| Date | Buyer | Sale Price | Title Company |
|---|---|---|---|
| Keller Joshua S | $225,500 | New Title Company Name | |
| Hofer Paul | $142,000 | Valley Title & Escrow | |
| Ista Susan M | -- | -- |
Source: Public Records
Mortgage History
We collect this data history from publicly available records. To have your information removed, we recommend requesting removal directly through your county’s website.
| Date | Status | Borrower | Loan Amount |
|---|---|---|---|
| Open | Keller Joshua S | $214,370 | |
| Previous Owner | Hofer Paul | $106,500 |
Source: Public Records
Tax History
| Year | Tax Paid | Tax Assessment Tax Assessment Total Assessment is a certain percentage of the fair market value that is determined by local assessors to be the total taxable value of land and additions on the property. | Land | Improvement |
|---|---|---|---|---|
| 2025 | $3,869 | $125,250 | $20,550 | $104,700 |
| 2024 | $3,540 | $119,500 | $18,700 | $100,800 |
| 2023 | $3,377 | $112,700 | $18,700 | $94,000 |
| 2022 | $3,328 | $106,000 | $18,700 | $87,300 |
| 2021 | $3,119 | $95,100 | $15,900 | $79,200 |
| 2020 | $2,994 | $92,800 | $15,900 | $76,900 |
| 2019 | $2,780 | $91,500 | $15,900 | $75,600 |
| 2018 | $2,632 | $89,900 | $15,900 | $74,000 |
| 2017 | $2,558 | $87,250 | $15,900 | $71,350 |
| 2016 | $2,733 | $84,350 | $15,900 | $68,450 |
| 2015 | $2,728 | $77,400 | $7,750 | $69,650 |
| 2014 | $2,578 | $72,350 | $7,750 | $64,600 |
| 2013 | $2,631 | $72,350 | $7,750 | $64,600 |
Source: Public Records
Map
Nearby Homes
- 706 14th Ave E
- 602 12 1 2 Ave E Unit 5
- 307 12th Ave E
- 239 12 1 2 Ave E
- 205 12th Ave E
- 622 12th Ave E
- 816 Lakeridge Place
- 840 Lakeridge Place
- 719 10th Ave E
- 302 10th Ave E
- 883 Lakeridge Place
- 715 Northridge Way
- 1816 Queensbury St
- 1811 7th St E
- 1827 7th St E
- 1731 6th St E
- 1224 Cedar Way
- 1814 Brentwood Ct
- 1844 1st St
- 1929 Pentland St
Your Personal Tour Guide
Ask me questions while you tour the home.