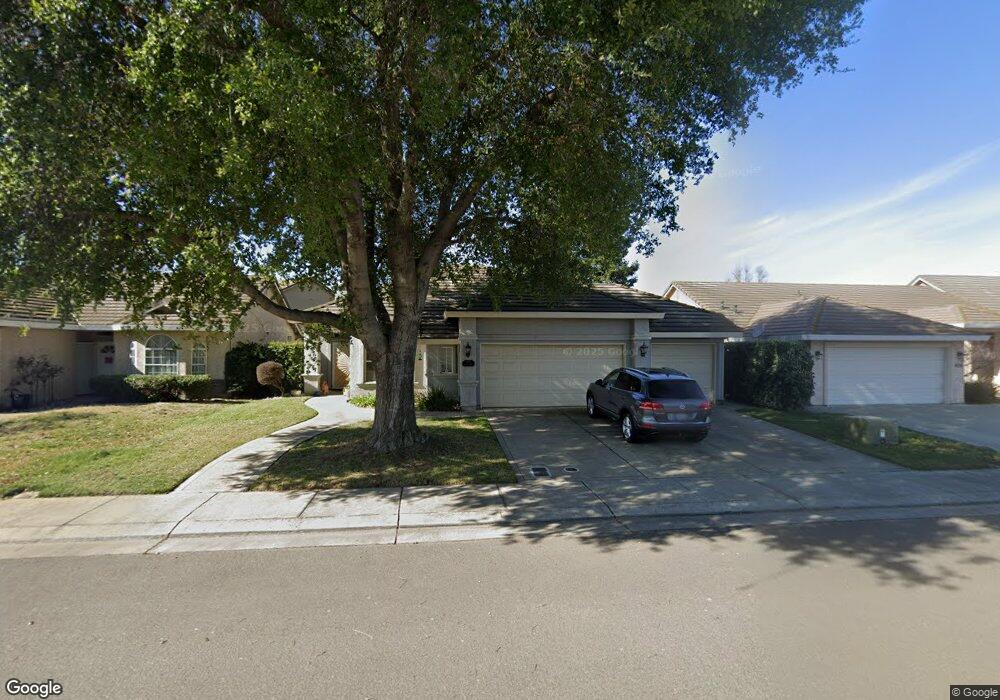
619 Black Oak Way Lodi, CA 95242
Sunwest NeighborhoodEstimated Value: $420,000 - $556,000
3
Beds
2
Baths
1,562
Sq Ft
$325/Sq Ft
Est. Value
About This Home
This home is located at 619 Black Oak Way, Lodi, CA 95242 and is currently estimated at $507,122, approximately $324 per square foot. 619 Black Oak Way is a home located in San Joaquin County with nearby schools including Erma B. Reese Elementary School, Millswood Middle School, and Lodi High School.
Ownership History
Date
Name
Owned For
Owner Type
Purchase Details
Closed on
Feb 11, 2019
Sold by
Angel James Eric
Bought by
Fam Angel Sr James E and Fam James E Angel Sr Revocable
Current Estimated Value
Purchase Details
Closed on
May 17, 2010
Sold by
Angel James Eric and Angel Laura Ann
Bought by
Angel James Eric
Home Financials for this Owner
Home Financials are based on the most recent Mortgage that was taken out on this home.
Original Mortgage
$131,500
Outstanding Balance
$87,880
Interest Rate
4.99%
Mortgage Type
New Conventional
Estimated Equity
$419,242
Purchase Details
Closed on
Jun 22, 1994
Sold by
Towne Ranch Associates
Bought by
Angel James Eric and Angel Laura Ann
Home Financials for this Owner
Home Financials are based on the most recent Mortgage that was taken out on this home.
Original Mortgage
$158,600
Interest Rate
8.6%
Create a Home Valuation Report for This Property
The Home Valuation Report is an in-depth analysis detailing your home's value as well as a comparison with similar homes in the area
Home Values in the Area
Average Home Value in this Area
Purchase History
| Date | Buyer | Sale Price | Title Company |
|---|---|---|---|
| Fam Angel Sr James E | -- | None Available | |
| Angel James Eric | -- | None Available | |
| Angel James Eric | $167,000 | Chicago Title Company |
Source: Public Records
Mortgage History
| Date | Status | Borrower | Loan Amount |
|---|---|---|---|
| Open | Angel James Eric | $131,500 | |
| Closed | Angel James Eric | $158,600 |
Source: Public Records
Tax History Compared to Growth
Tax History
| Year | Tax Paid | Tax Assessment Tax Assessment Total Assessment is a certain percentage of the fair market value that is determined by local assessors to be the total taxable value of land and additions on the property. | Land | Improvement |
|---|---|---|---|---|
| 2025 | $3,006 | $283,697 | $101,957 | $181,740 |
| 2024 | $2,923 | $278,135 | $99,958 | $178,177 |
| 2023 | $2,887 | $272,683 | $97,999 | $174,684 |
| 2022 | $2,822 | $267,337 | $96,078 | $171,259 |
| 2021 | $2,871 | $262,096 | $94,195 | $167,901 |
| 2020 | $2,796 | $259,410 | $93,230 | $166,180 |
| 2019 | $2,738 | $254,324 | $91,402 | $162,922 |
| 2018 | $2,698 | $249,338 | $89,610 | $159,728 |
| 2017 | $2,637 | $244,450 | $87,853 | $156,597 |
| 2016 | $2,470 | $239,657 | $86,130 | $153,527 |
| 2014 | $2,409 | $231,434 | $83,175 | $148,259 |
Source: Public Records
Map
Nearby Homes
- 2526 Park Dr W
- 2662 Veneto Ct
- 2670 Manza Ct
- 2937 Heritage Oak Way
- 991 Harvest Crossing St
- 406 Whitney St
- 2408 Tejon St
- 324 Applewood Dr
- 1111 Brighton Way
- 641 Rutledge Dr
- 2400 Eilers Ln Unit 1703
- 2400 Eilers Ln Unit 1906
- 2400 Eilers Ln Unit 1607
- 2355 Woodlake Cir
- 2651 Douglas Fir Dr
- 2401 Eilers Ln Unit 1003
- 2401 Eilers Ln Unit 304
- 208 Palomar Dr
- 2300 Eilers Ln
- 2439 Inglewood Dr
- 625 Black Oak Way
- 613 Black Oak Way
- 634 Oakmont Ct
- 631 Black Oak Way
- 607 Black Oak Way
- 626 Oakmont Ct
- 640 Oakmont Ct
- 618 Black Oak Way
- 624 Black Oak Way
- 612 Black Oak Way
- 637 Black Oak Way
- 630 Black Oak Way
- 646 Oakmont Ct
- 509 Black Oak Way
- 606 Black Oak Way
- 636 Black Oak Way
- 612 Oakmont Ct
- 705 Black Oak Way
- 452 Madrone Ct
- 652 Oakmont Ct