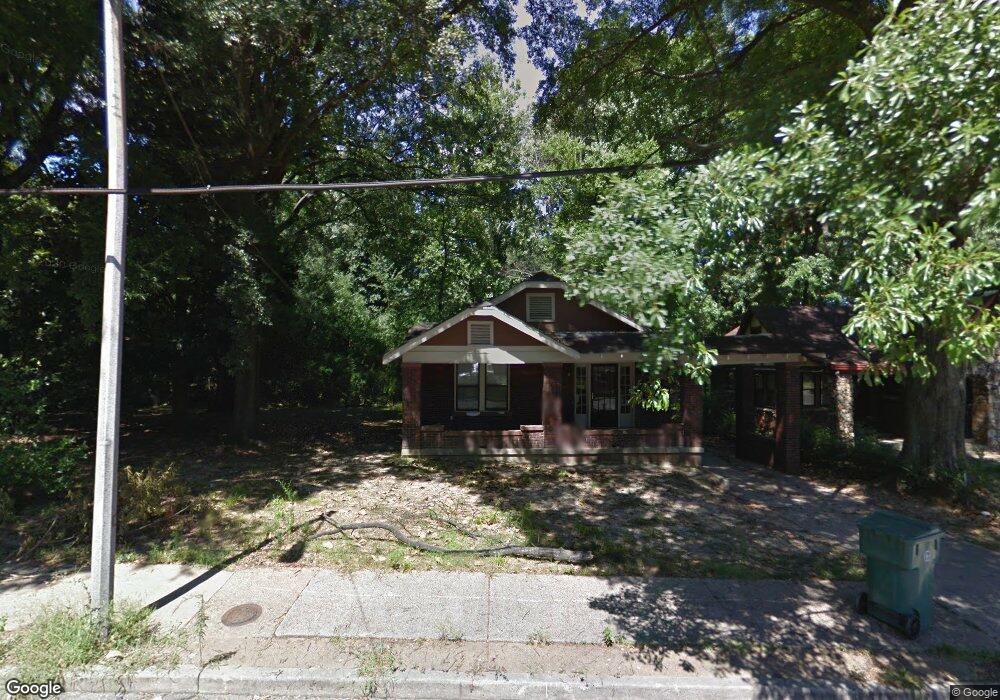
619 Mcconnell St Memphis, TN 38112
Binghampton NeighborhoodEstimated Value: $145,000 - $201,000
3
Beds
1
Bath
1,554
Sq Ft
$111/Sq Ft
Est. Value
About This Home
This home is located at 619 Mcconnell St, Memphis, TN 38112 and is currently estimated at $172,623, approximately $111 per square foot. 619 Mcconnell St is a home located in Shelby County with nearby schools including Brewster Elementary School, Treadwell Middle School, and Central High School.
Ownership History
Date
Name
Owned For
Owner Type
Purchase Details
Closed on
Sep 18, 2019
Sold by
Midwest Homesbuyers Gp
Bought by
Johnston David S
Current Estimated Value
Home Financials for this Owner
Home Financials are based on the most recent Mortgage that was taken out on this home.
Original Mortgage
$60,000
Outstanding Balance
$52,555
Interest Rate
3.6%
Mortgage Type
New Conventional
Estimated Equity
$120,068
Purchase Details
Closed on
Jan 11, 2019
Sold by
Bava Properties Llc
Bought by
Mid South Homebuyers Gp
Purchase Details
Closed on
Jun 4, 2010
Sold by
Household Financial Center Inc
Bought by
Bava Properties Llc
Purchase Details
Closed on
Apr 27, 2010
Sold by
Harris Dwight D and Harris Gwendolyn A
Bought by
Household Financial Center Inc
Purchase Details
Closed on
Oct 18, 2001
Sold by
County Of Shelby
Bought by
Fay Kathryn
Create a Home Valuation Report for This Property
The Home Valuation Report is an in-depth analysis detailing your home's value as well as a comparison with similar homes in the area
Home Values in the Area
Average Home Value in this Area
Purchase History
| Date | Buyer | Sale Price | Title Company |
|---|---|---|---|
| Johnston David S | $75,000 | Saddle Creek Title Llc | |
| Mid South Homebuyers Gp | $8,000 | Saddle Creek Title Llc | |
| Bava Properties Llc | $10,000 | None Available | |
| Household Financial Center Inc | $17,000 | None Available | |
| Fay Kathryn | $3,400 | -- |
Source: Public Records
Mortgage History
| Date | Status | Borrower | Loan Amount |
|---|---|---|---|
| Open | Johnston David S | $60,000 |
Source: Public Records
Tax History Compared to Growth
Tax History
| Year | Tax Paid | Tax Assessment Tax Assessment Total Assessment is a certain percentage of the fair market value that is determined by local assessors to be the total taxable value of land and additions on the property. | Land | Improvement |
|---|---|---|---|---|
| 2025 | -- | $41,425 | $6,000 | $35,425 |
| 2024 | -- | $18,900 | $2,000 | $16,900 |
| 2023 | $1,151 | $18,900 | $2,000 | $16,900 |
| 2022 | $1,151 | $18,900 | $2,000 | $16,900 |
| 2021 | $652 | $18,900 | $2,000 | $16,900 |
| 2020 | $998 | $13,775 | $2,000 | $11,775 |
| 2019 | $440 | $13,775 | $2,000 | $11,775 |
| 2018 | $440 | $13,775 | $2,000 | $11,775 |
| 2017 | $451 | $13,775 | $2,000 | $11,775 |
| 2016 | $568 | $13,000 | $0 | $0 |
| 2014 | $568 | $13,000 | $0 | $0 |
Source: Public Records
Map
Nearby Homes
- 2370 Faxon Ave
- 598 N Trezevant St
- 605 N Hollywood St
- 668 Spring St
- 2388 Forrest Ave
- 2388 Forest Ave
- 578 N Hollywood St
- 629 Eva St
- 724 Mcconnell St
- 2386 Parkway Place
- 679 East Dr
- 2236 Cross Dr
- 780 N Trezevant St
- 724 Center Dr
- 763 N Merton St
- 2363 Autumn Ave
- 2293 Jackson Ave
- 2283 Jackson Ave
- 2275 Jackson Ave
- 0 Whitman Ave
- 625 Mcconnell St
- 609 Mcconnell St
- 627 Mcconnell St
- 603 Mcconnell St
- 622 Mcconnell St
- 616 Mcconnell St
- 633 Mcconnell St
- 626 Mcconnell St
- 612 Mcconnell St
- 637 Mcconnell St
- 630 Mcconnell St
- 597 Mcconnell St
- 606 Mcconnell St
- 2378 Faxon Ave
- 636 Mcconnell St
- 602 Mcconnell St
- 642 Mcconnell St
- 598 Mcconnell St
- 621 Spring St
- 615 Spring St