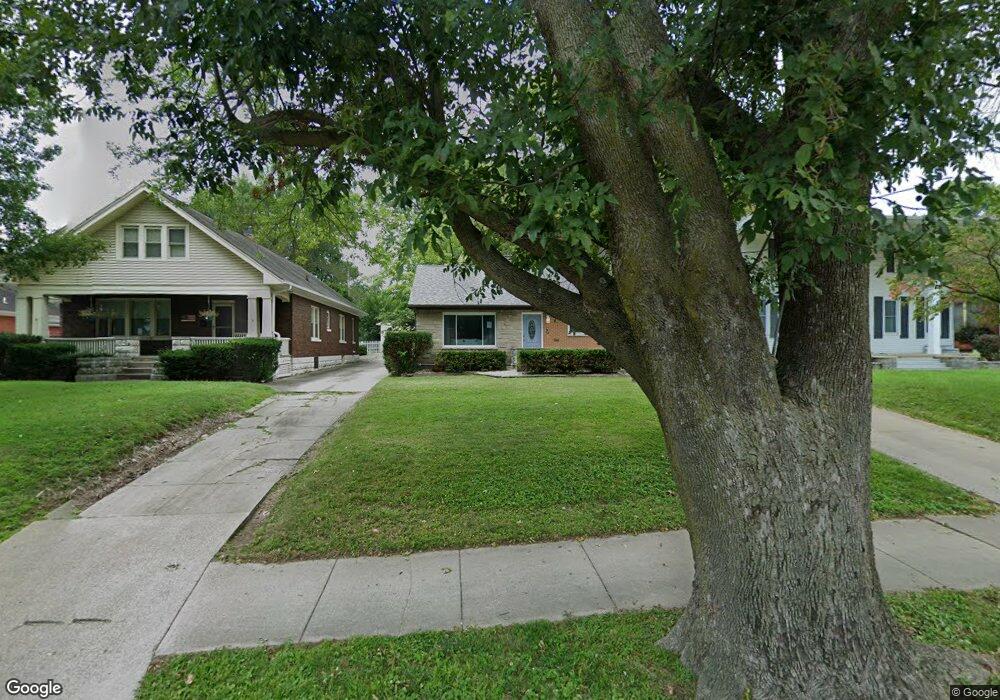
619 N 24th St Quincy, IL 62301
Estimated Value: $151,000 - $192,000
3
Beds
1
Bath
1,150
Sq Ft
$150/Sq Ft
Est. Value
About This Home
This home is located at 619 N 24th St, Quincy, IL 62301 and is currently estimated at $172,533, approximately $150 per square foot. 619 N 24th St is a home located in Adams County with nearby schools including Rooney Elementary School, Quincy Junior High School, and Quincy Senior High School.
Ownership History
Date
Name
Owned For
Owner Type
Purchase Details
Closed on
Sep 9, 2024
Sold by
Sparks Home Automation & Real Estate Llc
Bought by
Rubottom Casey L
Current Estimated Value
Home Financials for this Owner
Home Financials are based on the most recent Mortgage that was taken out on this home.
Original Mortgage
$127,600
Outstanding Balance
$126,105
Interest Rate
6.25%
Mortgage Type
New Conventional
Estimated Equity
$46,428
Purchase Details
Closed on
May 24, 2024
Sold by
Jc Warren Enterprises Llc
Bought by
Sparks Hm Automation & R/E Llc
Create a Home Valuation Report for This Property
The Home Valuation Report is an in-depth analysis detailing your home's value as well as a comparison with similar homes in the area
Home Values in the Area
Average Home Value in this Area
Purchase History
| Date | Buyer | Sale Price | Title Company |
|---|---|---|---|
| Rubottom Casey L | $159,500 | None Listed On Document | |
| Sparks Hm Automation & R/E Llc | $75,188 | Tl Title Llc |
Source: Public Records
Mortgage History
| Date | Status | Borrower | Loan Amount |
|---|---|---|---|
| Open | Rubottom Casey L | $127,600 |
Source: Public Records
Tax History Compared to Growth
Tax History
| Year | Tax Paid | Tax Assessment Tax Assessment Total Assessment is a certain percentage of the fair market value that is determined by local assessors to be the total taxable value of land and additions on the property. | Land | Improvement |
|---|---|---|---|---|
| 2024 | $2,707 | $41,520 | $5,760 | $35,760 |
| 2023 | $2,548 | $38,520 | $5,340 | $33,180 |
| 2022 | $2,410 | $35,970 | $4,990 | $30,980 |
| 2021 | $2,507 | $36,380 | $4,890 | $31,490 |
| 2020 | $2,459 | $35,670 | $4,790 | $30,880 |
| 2019 | $2,413 | $35,290 | $4,740 | $30,550 |
| 2018 | $2,394 | $34,600 | $4,650 | $29,950 |
| 2017 | $2,334 | $34,250 | $4,600 | $29,650 |
| 2016 | $2,291 | $32,850 | $4,410 | $28,440 |
| 2015 | $2,199,540 | $32,850 | $4,410 | $28,440 |
| 2012 | $1,272 | $31,760 | $4,270 | $27,490 |
Source: Public Records
Map
Nearby Homes