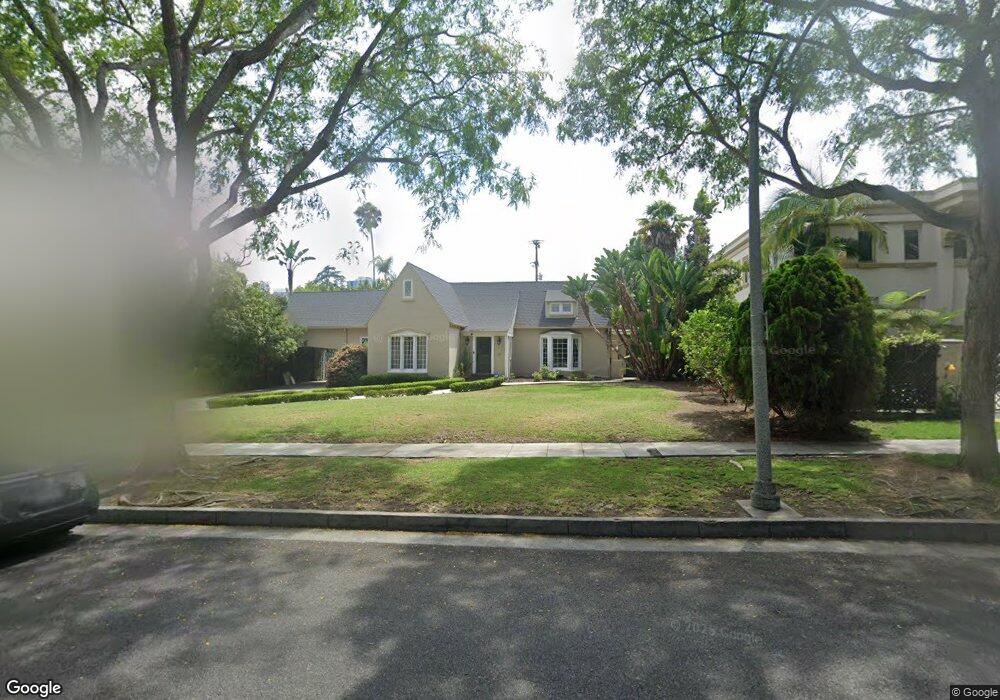
619 N Roxbury Dr Beverly Hills, CA 90210
Estimated Value: $6,183,913 - $7,958,000
3
Beds
4
Baths
3,337
Sq Ft
$2,067/Sq Ft
Est. Value
About This Home
This home is located at 619 N Roxbury Dr, Beverly Hills, CA 90210 and is currently estimated at $6,898,728, approximately $2,067 per square foot. 619 N Roxbury Dr is a home located in Los Angeles County with nearby schools including El Rodeo Elementary School, Beverly Hills High School, and Good Shepherd Catholic School.
Ownership History
Date
Name
Owned For
Owner Type
Purchase Details
Closed on
Oct 9, 2017
Sold by
Haddadzadeh Mina Laya
Bought by
Haddadzadeh Mina Laya and The Mina Laya Haddadzadeh Trust
Current Estimated Value
Purchase Details
Closed on
Jan 5, 2005
Sold by
Banihashemi Eftekar and Eftekar Banihashemi Living Tru
Bought by
Haddadzadeh Mina L
Purchase Details
Closed on
Aug 28, 1996
Sold by
Banihashemi Eftekar
Bought by
Banihashemi Eftekar and Eftekar Banihashemi Living Trust
Purchase Details
Closed on
Mar 22, 1996
Sold by
Shadanloo Saeid and Shadanloo Mina
Bought by
Home Svgs Of America Fsb
Purchase Details
Closed on
Mar 18, 1996
Sold by
Shandanloo Saeid
Bought by
Haddadzadeh Mina
Purchase Details
Closed on
Mar 7, 1996
Sold by
Haddadzadeh Mina
Bought by
Banihashemi Eftekhar
Create a Home Valuation Report for This Property
The Home Valuation Report is an in-depth analysis detailing your home's value as well as a comparison with similar homes in the area
Home Values in the Area
Average Home Value in this Area
Purchase History
| Date | Buyer | Sale Price | Title Company |
|---|---|---|---|
| Haddadzadeh Mina Laya | -- | None Available | |
| Haddadzadeh Mina L | -- | -- | |
| Banihashemi Eftekar | -- | -- | |
| Home Svgs Of America Fsb | $1,054,731 | Fidelity National Title Ins | |
| Haddadzadeh Mina | -- | Stewart Title Company | |
| Banihashemi Eftekhar | $890,000 | Stewart Title Company |
Source: Public Records
Tax History Compared to Growth
Tax History
| Year | Tax Paid | Tax Assessment Tax Assessment Total Assessment is a certain percentage of the fair market value that is determined by local assessors to be the total taxable value of land and additions on the property. | Land | Improvement |
|---|---|---|---|---|
| 2025 | $19,544 | $1,622,688 | $1,297,850 | $324,838 |
| 2024 | $19,544 | $1,590,871 | $1,272,402 | $318,469 |
| 2023 | $19,199 | $1,559,678 | $1,247,453 | $312,225 |
| 2022 | $18,657 | $1,529,097 | $1,222,994 | $306,103 |
| 2021 | $18,106 | $1,499,115 | $1,199,014 | $300,101 |
| 2019 | $17,591 | $1,454,651 | $1,163,451 | $291,200 |
| 2018 | $16,784 | $1,426,130 | $1,140,639 | $285,491 |
| 2016 | $16,091 | $1,370,754 | $1,096,348 | $274,406 |
| 2015 | $15,458 | $1,350,165 | $1,079,880 | $270,285 |
| 2014 | $14,905 | $1,323,718 | $1,058,727 | $264,991 |
Source: Public Records
Map
Nearby Homes
- 620 Walden Dr
- 620 N Bedford Dr
- 703 Walden Dr
- 701 N Camden Dr
- 709 N Camden Dr
- 710 N Camden Dr
- 710 N Rodeo Dr
- 701 N Beverly Dr
- 610 N Beverly Dr
- 602 N Beverly Dr
- 1405 Park Way
- 9900 S Santa Monica Blvd Unit 3A
- 9900 S Santa Monica Blvd Unit 2F
- 9900 S Santa Monica Blvd Unit 2D
- 9900 S Santa Monica Blvd Unit PHE
- 523 N Canon Dr
- 812 N Bedford Dr
- 814 N Bedford Dr
- 826 Greenway Dr
- 716 N Beverly Dr
- 617 N Roxbury Dr
- 621 N Roxbury Dr
- 615 N Roxbury Dr
- 618 N Linden Dr
- 620 N Linden Dr
- 623 N Roxbury Dr
- 616 N Linden Dr
- 622 N Linden Dr
- 620 N Roxbury Dr
- 618 N Roxbury Dr
- 613 N Roxbury Dr
- 614 N Linden Dr
- 616 N Roxbury Dr
- 624 N Roxbury Dr
- 612 N Linden Dr
- 614 N Roxbury Dr
- 611 N Roxbury Dr
- 701 N Roxbury Dr
- 700 N Linden Dr
- 612 N Roxbury Dr