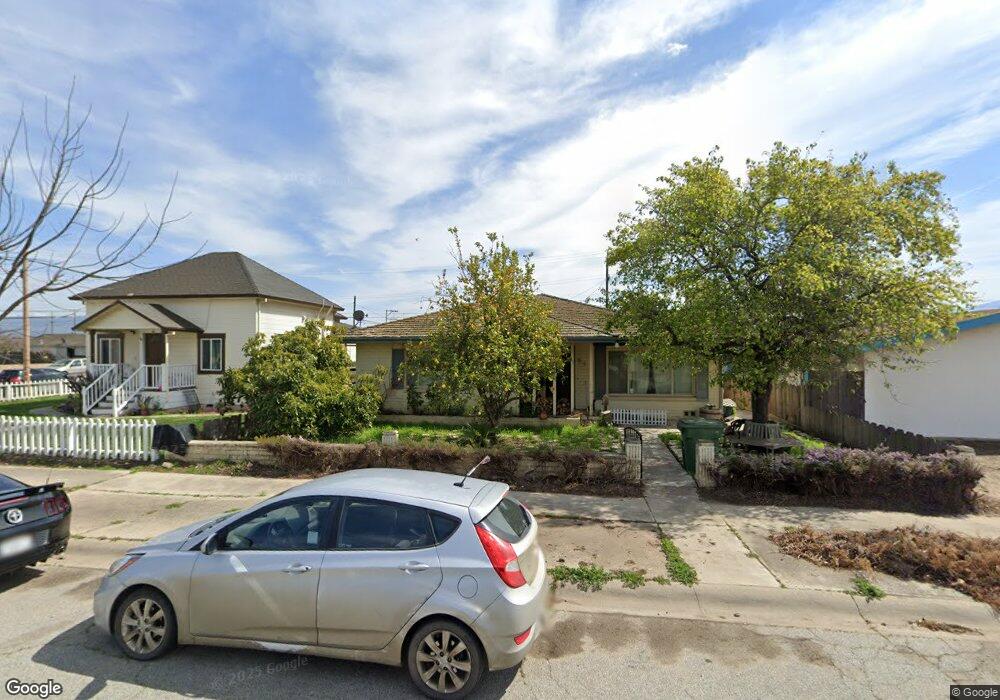
62 A St Gonzales, CA 93926
Estimated Value: $541,000 - $671,000
2
Beds
2
Baths
1,680
Sq Ft
$368/Sq Ft
Est. Value
About This Home
This home is located at 62 A St, Gonzales, CA 93926 and is currently estimated at $618,966, approximately $368 per square foot. 62 A St is a home with nearby schools including La Gloria Elementary School, Fairview Middle School, and Gonzales High School.
Ownership History
Date
Name
Owned For
Owner Type
Purchase Details
Closed on
Dec 5, 2013
Sold by
Thorp Roxanne M and Thorp Roxane
Bought by
Thorp Roxane and 2012 Roxane Thorp Revocable Trust
Current Estimated Value
Purchase Details
Closed on
Jul 8, 2005
Sold by
Thorp Michael
Bought by
Thorp Roxanne M
Home Financials for this Owner
Home Financials are based on the most recent Mortgage that was taken out on this home.
Original Mortgage
$302,000
Outstanding Balance
$156,832
Interest Rate
5.58%
Mortgage Type
Purchase Money Mortgage
Estimated Equity
$462,134
Purchase Details
Closed on
Mar 25, 1998
Sold by
Lugo Ruben and Lugo Roxane M
Bought by
Lugo Ruben and Lugo Roxane M
Home Financials for this Owner
Home Financials are based on the most recent Mortgage that was taken out on this home.
Original Mortgage
$149,400
Interest Rate
7.06%
Purchase Details
Closed on
Sep 20, 1995
Sold by
Pisoni Arnold and Pisoni Geraldine
Bought by
Lugo Ruben and Lugo Roxanne
Create a Home Valuation Report for This Property
The Home Valuation Report is an in-depth analysis detailing your home's value as well as a comparison with similar homes in the area
Home Values in the Area
Average Home Value in this Area
Purchase History
| Date | Buyer | Sale Price | Title Company |
|---|---|---|---|
| Thorp Roxane | -- | None Available | |
| Thorp Roxanne M | -- | Chicago Title | |
| Thorp Roxanne M | $206,000 | -- | |
| Lugo Ruben | -- | Stewart Title | |
| Lugo Ruben | -- | -- |
Source: Public Records
Mortgage History
| Date | Status | Borrower | Loan Amount |
|---|---|---|---|
| Open | Thorp Roxanne M | $302,000 | |
| Previous Owner | Lugo Ruben | $149,400 |
Source: Public Records
Tax History
| Year | Tax Paid | Tax Assessment Tax Assessment Total Assessment is a certain percentage of the fair market value that is determined by local assessors to be the total taxable value of land and additions on the property. | Land | Improvement |
|---|---|---|---|---|
| 2025 | $4,407 | $413,241 | $166,548 | $246,693 |
| 2024 | $4,407 | $405,139 | $163,283 | $241,856 |
| 2023 | $4,497 | $397,196 | $160,082 | $237,114 |
| 2022 | $4,643 | $389,409 | $156,944 | $232,465 |
| 2021 | $4,648 | $381,774 | $153,867 | $227,907 |
| 2020 | $4,073 | $377,861 | $152,290 | $225,571 |
| 2019 | $3,959 | $370,453 | $149,304 | $221,149 |
| 2018 | $3,887 | $363,190 | $146,377 | $216,813 |
| 2017 | $3,808 | $356,069 | $143,507 | $212,562 |
| 2016 | $3,664 | $349,089 | $140,694 | $208,395 |
| 2015 | -- | $310,000 | $125,000 | $185,000 |
| 2014 | -- | $221,000 | $89,000 | $132,000 |
Source: Public Records
Map
Nearby Homes
- 330 Day St
- 960 Elko St
- 1421 Burgundy Way
- 1352 River Rd
- 1504 River Rd
- 31102 Camphora Gloria Rd
- 29225 Chualar Canyon Rd
- 29155 Chualar Canyon Rd
- 29145 Chualar Canyon Rd
- 715 Skinner St
- 1390 Appalachian St
- 844 River Rd
- 509 Davalos St
- 1061 Vista Ave
- 641 Main St
- 615 Monterey St
- 35095 Metz Rd
- 965 Las Flores St
- 1311 San Antonio
- 704 Gabilan Dr
Your Personal Tour Guide
Ask me questions while you tour the home.