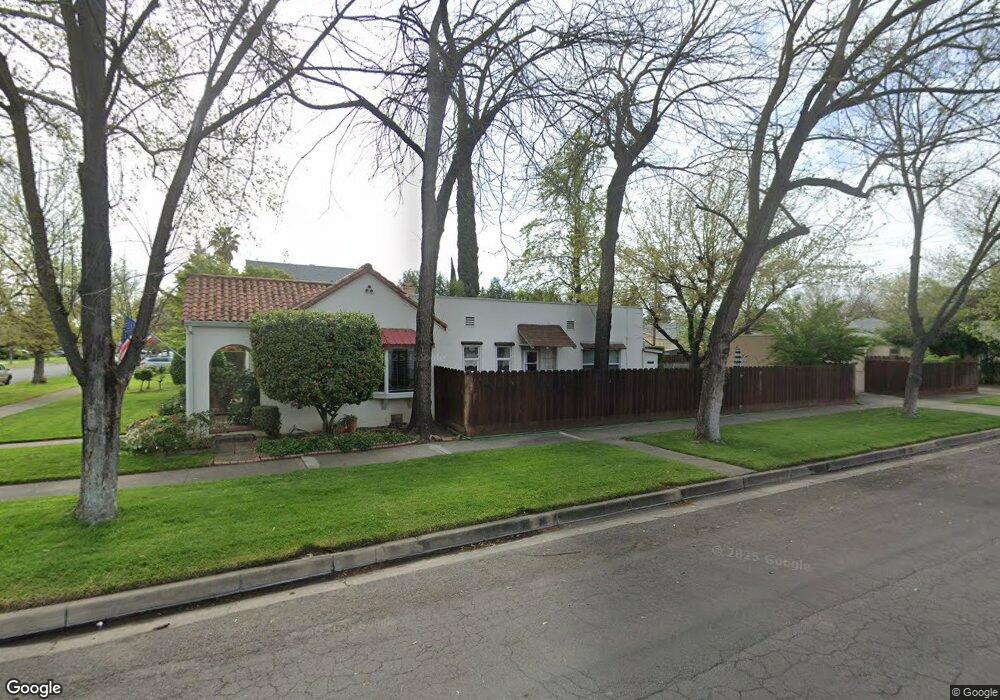
62 W 27th St Merced, CA 95340
Downtown Merced NeighborhoodEstimated Value: $318,000 - $542,000
3
Beds
1
Bath
1,320
Sq Ft
$294/Sq Ft
Est. Value
About This Home
This home is located at 62 W 27th St, Merced, CA 95340 and is currently estimated at $387,514, approximately $293 per square foot. 62 W 27th St is a home located in Merced County with nearby schools including John Muir Elementary School, Herbert Hoover Middle School, and Merced High School.
Ownership History
Date
Name
Owned For
Owner Type
Purchase Details
Closed on
May 30, 2023
Sold by
Moffitt Mary W
Bought by
Mary W Moffitt 2023 Trust and Moffitt
Current Estimated Value
Purchase Details
Closed on
May 24, 2023
Sold by
Moffitt Mary W
Bought by
Mary W Moffitt 2023 Trust
Purchase Details
Closed on
Dec 22, 2022
Sold by
Phyllis F Oneal 2021 Trust
Bought by
Moffitt Mary W
Purchase Details
Closed on
Aug 26, 2021
Sold by
Oneal Phyllis F
Bought by
Oneal Phyllis F and The Phyllis F Oneal 2021 Trust
Create a Home Valuation Report for This Property
The Home Valuation Report is an in-depth analysis detailing your home's value as well as a comparison with similar homes in the area
Home Values in the Area
Average Home Value in this Area
Purchase History
| Date | Buyer | Sale Price | Title Company |
|---|---|---|---|
| Mary W Moffitt 2023 Trust | -- | None Listed On Document | |
| Mary W Moffitt 2023 Trust | -- | None Listed On Document | |
| Moffitt Mary W | -- | -- | |
| Oneal Phyllis F | -- | None Available |
Source: Public Records
Tax History
| Year | Tax Paid | Tax Assessment Tax Assessment Total Assessment is a certain percentage of the fair market value that is determined by local assessors to be the total taxable value of land and additions on the property. | Land | Improvement |
|---|---|---|---|---|
| 2025 | $3,371 | $327,726 | $88,434 | $239,292 |
| 2024 | $3,371 | $321,300 | $86,700 | $234,600 |
| 2023 | $3,323 | $315,000 | $85,000 | $230,000 |
| 2022 | $1,250 | $121,399 | $36,782 | $84,617 |
| 2021 | $1,246 | $119,019 | $36,061 | $82,958 |
| 2020 | $1,254 | $117,800 | $35,692 | $82,108 |
| 2019 | $1,233 | $115,492 | $34,993 | $80,499 |
| 2018 | $1,123 | $113,228 | $34,307 | $78,921 |
| 2017 | $1,164 | $111,009 | $33,635 | $77,374 |
| 2016 | $1,144 | $108,833 | $32,976 | $75,857 |
| 2015 | $1,125 | $107,199 | $32,481 | $74,718 |
| 2014 | $1,099 | $105,100 | $31,845 | $73,255 |
Source: Public Records
Map
Nearby Homes
- 121 W 25th St
- 8 W 25th St
- 261 W 26th St
- 230 W 25th St
- 2804 Mccombs Dr
- 2819 Tenaya Dr
- 425 E 27th St
- 0 E North Bear Creek Dr
- 1 E North Bear Creek Dr
- 112 W 23rd St
- 415 W 25th St
- 2669 6th Ave
- 15 E 22nd St
- 148 E 23rd St
- 319 W 22nd St
- 127 W 21st St
- 2151 Martin Luther King jr Way
- 2038 H St
- 303 W 21st St
- 203 W 20th St
Your Personal Tour Guide
Ask me questions while you tour the home.