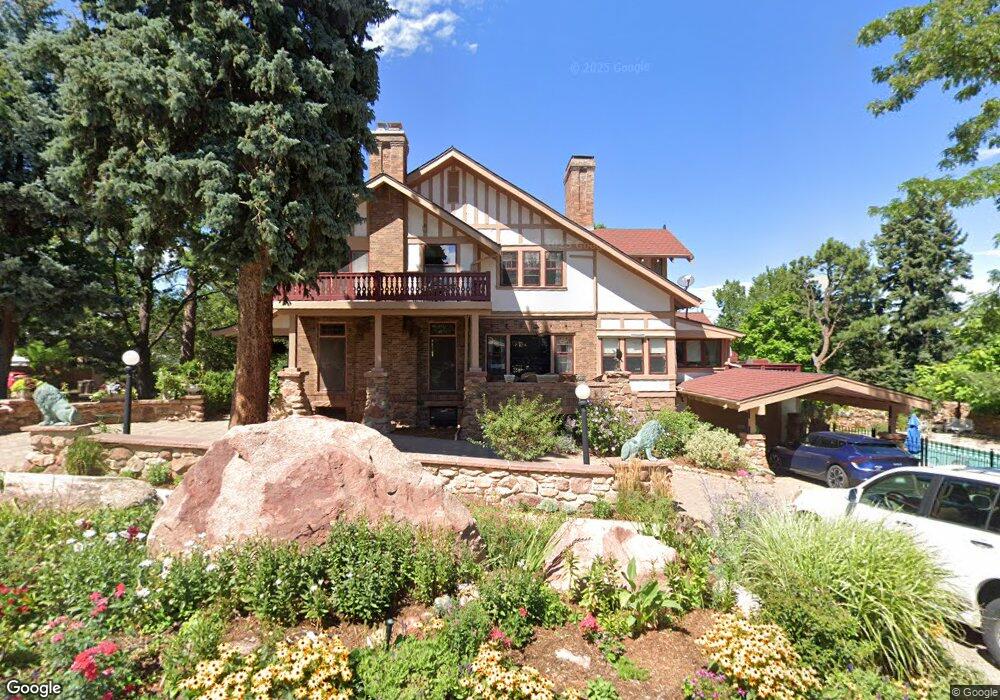
620 12th St Boulder, CO 80302
University Hill NeighborhoodEstimated Value: $3,351,000 - $4,904,000
5
Beds
5
Baths
4,362
Sq Ft
$994/Sq Ft
Est. Value
About This Home
This home is located at 620 12th St, Boulder, CO 80302 and is currently estimated at $4,333,900, approximately $993 per square foot. 620 12th St is a home located in Boulder County with nearby schools including Flatirons Elementary School, Manhattan Middle School of the Arts & Academics, and Boulder High School.
Ownership History
Date
Name
Owned For
Owner Type
Purchase Details
Closed on
Aug 8, 2013
Sold by
Siegel Mo
Bought by
Siegel Morris J
Current Estimated Value
Purchase Details
Closed on
Jan 21, 1985
Bought by
Siegel Morris J
Purchase Details
Closed on
Dec 19, 1979
Bought by
Siegel Morris J
Purchase Details
Closed on
Sep 6, 1979
Bought by
Siegel Morris J
Create a Home Valuation Report for This Property
The Home Valuation Report is an in-depth analysis detailing your home's value as well as a comparison with similar homes in the area
Home Values in the Area
Average Home Value in this Area
Purchase History
| Date | Buyer | Sale Price | Title Company |
|---|---|---|---|
| Siegel Morris J | -- | None Available | |
| Siegel Morris J | $515,000 | -- | |
| Siegel Morris J | $320,000 | -- | |
| Siegel Morris J | -- | -- |
Source: Public Records
Tax History
| Year | Tax Paid | Tax Assessment Tax Assessment Total Assessment is a certain percentage of the fair market value that is determined by local assessors to be the total taxable value of land and additions on the property. | Land | Improvement |
|---|---|---|---|---|
| 2025 | $27,470 | $266,063 | $165,000 | $101,063 |
| 2024 | $27,470 | $266,063 | $165,000 | $101,063 |
| 2023 | $26,993 | $319,268 | $170,234 | $152,720 |
| 2022 | $24,005 | $265,449 | $143,622 | $121,827 |
| 2021 | $22,891 | $273,087 | $147,755 | $125,332 |
| 2020 | $21,009 | $248,506 | $140,069 | $108,437 |
| 2019 | $20,687 | $248,506 | $140,069 | $108,437 |
| 2018 | $18,907 | $225,274 | $89,928 | $135,346 |
| 2017 | $18,315 | $249,052 | $99,420 | $149,632 |
| 2016 | $16,185 | $186,972 | $74,585 | $112,387 |
| 2015 | $15,326 | $168,680 | $91,460 | $77,220 |
| 2014 | $14,183 | $168,680 | $91,460 | $77,220 |
Source: Public Records
Map
Nearby Homes
Your Personal Tour Guide
Ask me questions while you tour the home.