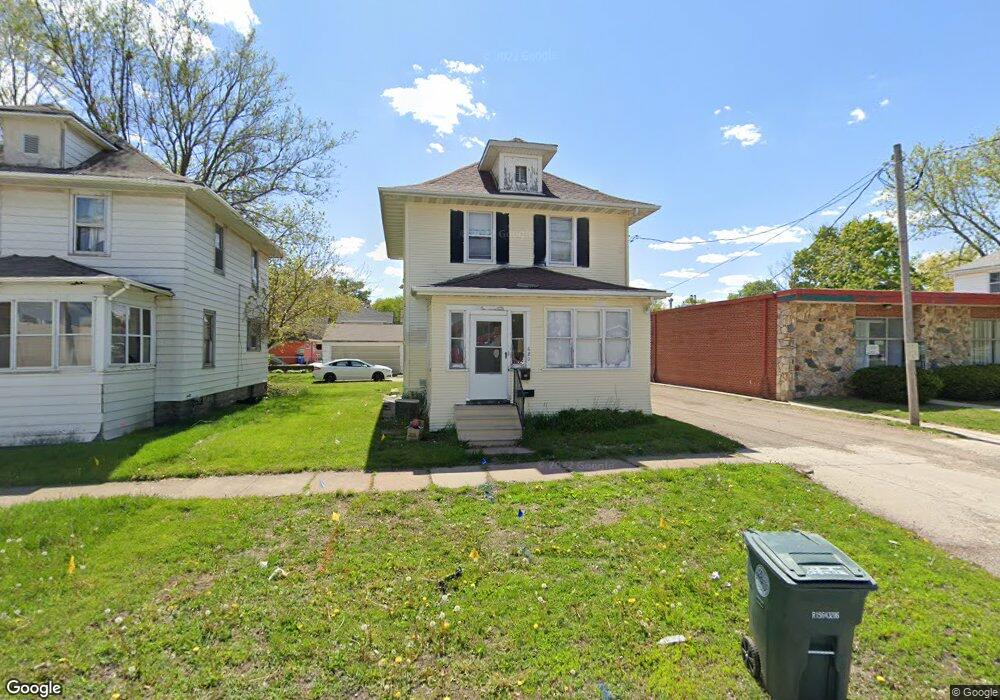
620 Allen St Waterloo, IA 50702
Church Row NeighborhoodEstimated Value: $37,000 - $80,000
3
Beds
1
Bath
1,232
Sq Ft
$47/Sq Ft
Est. Value
About This Home
This home is located at 620 Allen St, Waterloo, IA 50702 and is currently estimated at $57,880, approximately $46 per square foot. 620 Allen St is a home located in Black Hawk County with nearby schools including Irving Elementary School, Central Middle School, and West High School.
Ownership History
Date
Name
Owned For
Owner Type
Purchase Details
Closed on
Jun 15, 2015
Sold by
Davis Richard D and Davis Linda L
Bought by
Anacapa Associates Llc
Current Estimated Value
Home Financials for this Owner
Home Financials are based on the most recent Mortgage that was taken out on this home.
Original Mortgage
$26,640
Interest Rate
2.5%
Mortgage Type
Land Contract Argmt. Of Sale
Create a Home Valuation Report for This Property
The Home Valuation Report is an in-depth analysis detailing your home's value as well as a comparison with similar homes in the area
Home Values in the Area
Average Home Value in this Area
Purchase History
| Date | Buyer | Sale Price | Title Company |
|---|---|---|---|
| Anacapa Associates Llc | $29,600 | None Available |
Source: Public Records
Mortgage History
| Date | Status | Borrower | Loan Amount |
|---|---|---|---|
| Closed | Anacapa Associates Llc | $26,640 |
Source: Public Records
Tax History Compared to Growth
Tax History
| Year | Tax Paid | Tax Assessment Tax Assessment Total Assessment is a certain percentage of the fair market value that is determined by local assessors to be the total taxable value of land and additions on the property. | Land | Improvement |
|---|---|---|---|---|
| 2025 | $1,056 | $68,420 | $4,880 | $63,540 |
| 2024 | $974 | $48,700 | $4,880 | $43,820 |
| 2023 | $930 | $48,700 | $4,880 | $43,820 |
| 2022 | $906 | $42,360 | $4,880 | $37,480 |
| 2021 | $898 | $42,360 | $4,880 | $37,480 |
| 2020 | $884 | $39,680 | $4,880 | $34,800 |
| 2019 | $884 | $39,680 | $4,880 | $34,800 |
| 2018 | $884 | $39,680 | $4,880 | $34,800 |
| 2017 | $912 | $39,680 | $4,880 | $34,800 |
| 2016 | $900 | $39,680 | $4,880 | $34,800 |
| 2015 | $900 | $39,680 | $4,880 | $34,800 |
| 2014 | $856 | $37,000 | $4,880 | $32,120 |
Source: Public Records
Map
Nearby Homes