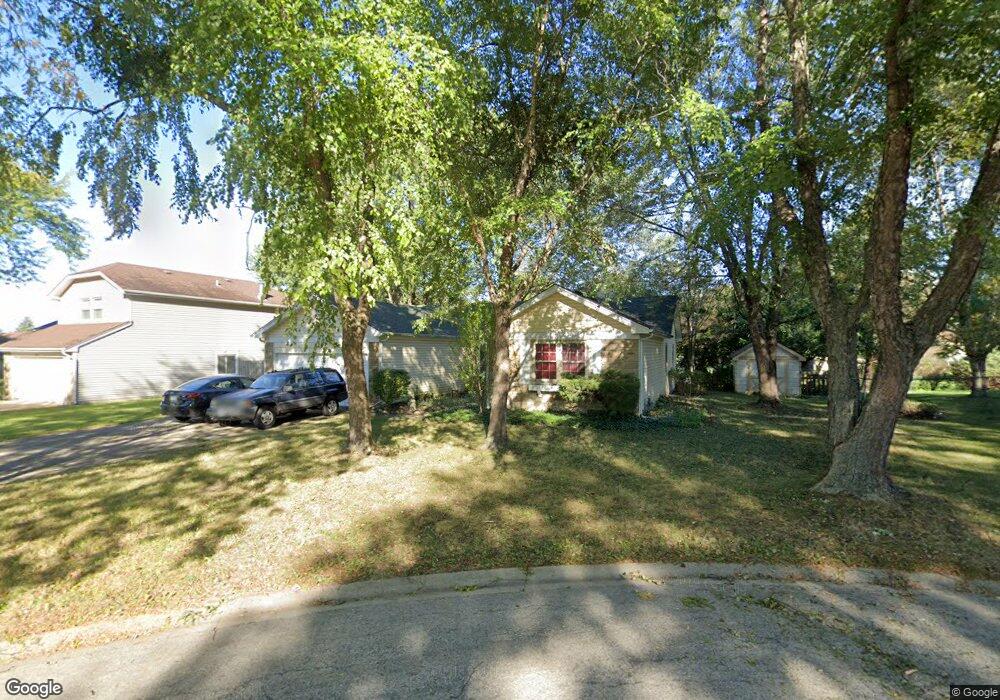
620 Chestnut Ct Algonquin, IL 60102
High Hill Farms NeighborhoodEstimated Value: $321,356 - $408,000
3
Beds
2
Baths
1,810
Sq Ft
$207/Sq Ft
Est. Value
About This Home
This home is located at 620 Chestnut Ct, Algonquin, IL 60102 and is currently estimated at $375,089, approximately $207 per square foot. 620 Chestnut Ct is a home located in McHenry County with nearby schools including Westfield Community School, Kenneth E Neubert Elementary School, and Harry D Jacobs High School.
Ownership History
Date
Name
Owned For
Owner Type
Purchase Details
Closed on
Jun 17, 2003
Sold by
Johnson Cheryl A
Bought by
Lehman Joseph A
Current Estimated Value
Home Financials for this Owner
Home Financials are based on the most recent Mortgage that was taken out on this home.
Original Mortgage
$126,600
Outstanding Balance
$57,742
Interest Rate
6.35%
Mortgage Type
Unknown
Estimated Equity
$317,347
Purchase Details
Closed on
Aug 4, 2000
Sold by
Carr Arthur R
Bought by
Johnson Cheryl A
Home Financials for this Owner
Home Financials are based on the most recent Mortgage that was taken out on this home.
Original Mortgage
$75,000
Interest Rate
7.37%
Purchase Details
Closed on
Sep 28, 1999
Sold by
Carr Marion R
Bought by
Carr Arthur
Create a Home Valuation Report for This Property
The Home Valuation Report is an in-depth analysis detailing your home's value as well as a comparison with similar homes in the area
Home Values in the Area
Average Home Value in this Area
Purchase History
| Date | Buyer | Sale Price | Title Company |
|---|---|---|---|
| Lehman Joseph A | $211,000 | St | |
| Lehman Joseph A | -- | -- | |
| Johnson Cheryl A | $167,000 | Attorneys Title Guaranty Fun | |
| Carr Arthur | -- | -- |
Source: Public Records
Mortgage History
| Date | Status | Borrower | Loan Amount |
|---|---|---|---|
| Open | Lehman Joseph A | $126,600 | |
| Previous Owner | Johnson Cheryl A | $75,000 |
Source: Public Records
Tax History
| Year | Tax Paid | Tax Assessment Tax Assessment Total Assessment is a certain percentage of the fair market value that is determined by local assessors to be the total taxable value of land and additions on the property. | Land | Improvement |
|---|---|---|---|---|
| 2024 | $6,629 | $92,736 | $23,614 | $69,122 |
| 2023 | $6,273 | $82,941 | $21,120 | $61,821 |
| 2022 | $6,719 | $84,342 | $21,044 | $63,298 |
| 2021 | $6,440 | $78,575 | $19,605 | $58,970 |
| 2020 | $6,267 | $75,793 | $18,911 | $56,882 |
| 2019 | $6,110 | $72,543 | $18,100 | $54,443 |
| 2018 | $5,816 | $67,015 | $16,721 | $50,294 |
| 2017 | $5,689 | $63,132 | $15,752 | $47,380 |
| 2016 | $5,596 | $59,212 | $14,774 | $44,438 |
| 2013 | -- | $58,790 | $13,783 | $45,007 |
Source: Public Records
Map
Nearby Homes
- 730 Chestnut Ct
- 615 Harper Dr
- 21 Division St
- 407 La Fox River Dr
- 909 Roger St
- 13 Brian Ct
- 0 River Dr N Unit MRD12473279
- 1354 Essex St Unit 2
- 720 Ash St
- 1200 Hillside View
- 966 Mesa Dr
- 1431 Essex St
- 935 Viewpoint Dr
- 1 N Hubbard St
- SWC Talaga and Algonquin Rd
- Lot #3-5 Hayes Rd
- 700 Fairfield Ln
- 298 Apache Trail
- LOT 3 Blackhawk Dr
- 600 E Algonquin Rd
- 630 Chestnut Ct
- 610 Chestnut Ct
- 631 Butterfield Dr
- 641 Butterfield Dr
- 621 Butterfield Dr
- 640 Chestnut Ct
- 615 Chestnut Ct
- 600 Chestnut Ct Unit 2
- 625 Chestnut Ct
- 651 Butterfield Dr
- 611 Butterfield Dr
- 605 Chestnut Ct
- 601 Butterfield Dr
- 635 Chestnut Ct
- 650 Chestnut Ct Unit 1
- 661 Butterfield Dr
- 612 Orchard Ct
- 602 Orchard Ct
- 645 Chestnut Ct
- 640 Butterfield Dr
Your Personal Tour Guide
Ask me questions while you tour the home.