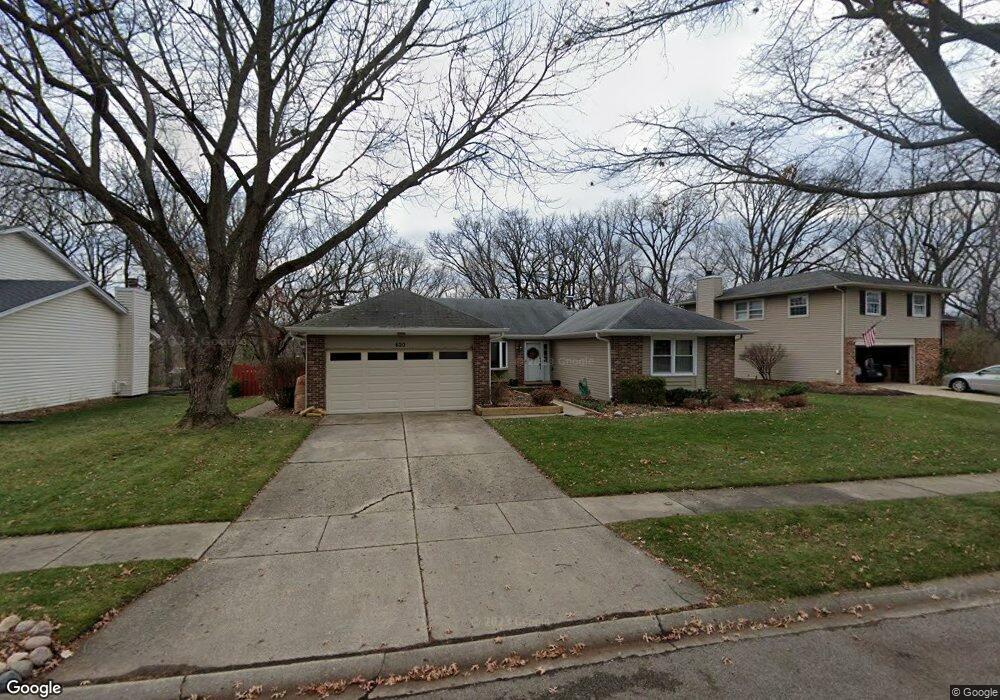
620 Juniper Cir Algonquin, IL 60102
High Hill Farms NeighborhoodEstimated Value: $328,425 - $392,000
3
Beds
2
Baths
1,810
Sq Ft
$204/Sq Ft
Est. Value
About This Home
This home is located at 620 Juniper Cir, Algonquin, IL 60102 and is currently estimated at $368,856, approximately $203 per square foot. 620 Juniper Cir is a home located in McHenry County with nearby schools including Westfield Community School, Kenneth E Neubert Elementary School, and Harry D Jacobs High School.
Ownership History
Date
Name
Owned For
Owner Type
Purchase Details
Closed on
Oct 1, 2002
Sold by
Greatbanc Trust Company
Bought by
Benson Richard W and Benson Kristine L
Current Estimated Value
Home Financials for this Owner
Home Financials are based on the most recent Mortgage that was taken out on this home.
Original Mortgage
$166,000
Outstanding Balance
$70,763
Interest Rate
6.39%
Estimated Equity
$298,093
Purchase Details
Closed on
Jun 13, 2002
Sold by
Stachowski Donna L
Bought by
Greatbanc Trust Company and Trust #8406
Purchase Details
Closed on
Mar 24, 2000
Sold by
Wysocki Bernard A and Wysocki Carol Cherveny
Bought by
Stachowski Julian H and Stachowski Donna L
Purchase Details
Closed on
Jul 17, 1995
Sold by
Hwalisz Mark J and Ellis Alysa L
Bought by
Wysocki Bernard A and Wysocki Carol Cherveny
Home Financials for this Owner
Home Financials are based on the most recent Mortgage that was taken out on this home.
Original Mortgage
$115,000
Interest Rate
7.79%
Create a Home Valuation Report for This Property
The Home Valuation Report is an in-depth analysis detailing your home's value as well as a comparison with similar homes in the area
Home Values in the Area
Average Home Value in this Area
Purchase History
| Date | Buyer | Sale Price | Title Company |
|---|---|---|---|
| Benson Richard W | $231,000 | Heritage Title Co | |
| Greatbanc Trust Company | -- | -- | |
| Stachowski Julian H | $182,000 | Intercounty Title | |
| Wysocki Bernard A | $168,000 | -- |
Source: Public Records
Mortgage History
| Date | Status | Borrower | Loan Amount |
|---|---|---|---|
| Open | Benson Richard W | $166,000 | |
| Previous Owner | Wysocki Bernard A | $115,000 |
Source: Public Records
Tax History
| Year | Tax Paid | Tax Assessment Tax Assessment Total Assessment is a certain percentage of the fair market value that is determined by local assessors to be the total taxable value of land and additions on the property. | Land | Improvement |
|---|---|---|---|---|
| 2024 | $6,307 | $96,626 | $25,628 | $70,998 |
| 2023 | $5,895 | $86,420 | $22,921 | $63,499 |
| 2022 | $6,787 | $90,139 | $24,007 | $66,132 |
| 2021 | $6,475 | $83,975 | $22,365 | $61,610 |
| 2020 | $6,286 | $81,002 | $21,573 | $59,429 |
| 2019 | $6,109 | $77,529 | $20,648 | $56,881 |
| 2018 | $5,778 | $71,620 | $19,074 | $52,546 |
| 2017 | $5,623 | $67,471 | $17,969 | $49,502 |
| 2016 | $5,498 | $63,281 | $16,853 | $46,428 |
| 2013 | -- | $61,516 | $15,723 | $45,793 |
Source: Public Records
Map
Nearby Homes
- 615 Harper Dr
- 730 Chestnut Ct
- 21 Division St
- 1 N Hubbard St
- SWC Talaga and Algonquin Rd
- 407 La Fox River Dr
- Lot #3-5 Hayes Rd
- 700 Fairfield Ln
- 13 Brian Ct
- 909 Roger St
- 0 River Dr N Unit MRD12473279
- 1033 Interloch Ct Unit 32
- 1431 Essex St
- 1002 Interloch Ct Unit 152
- 308 Rustic Ln
- 1105 Spring Hill Dr
- 1820 Crofton Dr
- 720 Ash St
- 966 Mesa Dr
- 741 Regal Ln
- 630 Juniper Cir
- 610 Juniper Cir
- 640 Juniper Cir
- 515 Harper Dr
- 600 Juniper Cir
- 745 Mulberry Ct
- 525 Harper Dr
- 505 Harper Dr
- 742 Evergreen Ct
- 750 Mulberry Ct
- 605 Harper Dr
- 425 Harper Dr
- 650 Juniper Cir
- 735 Mulberry Ct
- 732 Evergreen Ct
- 740 Mulberry Ct
- 415 Harper Dr
- 741 Evergreen Ct
- 722 Evergreen Ct
- 660 Juniper Cir
Your Personal Tour Guide
Ask me questions while you tour the home.