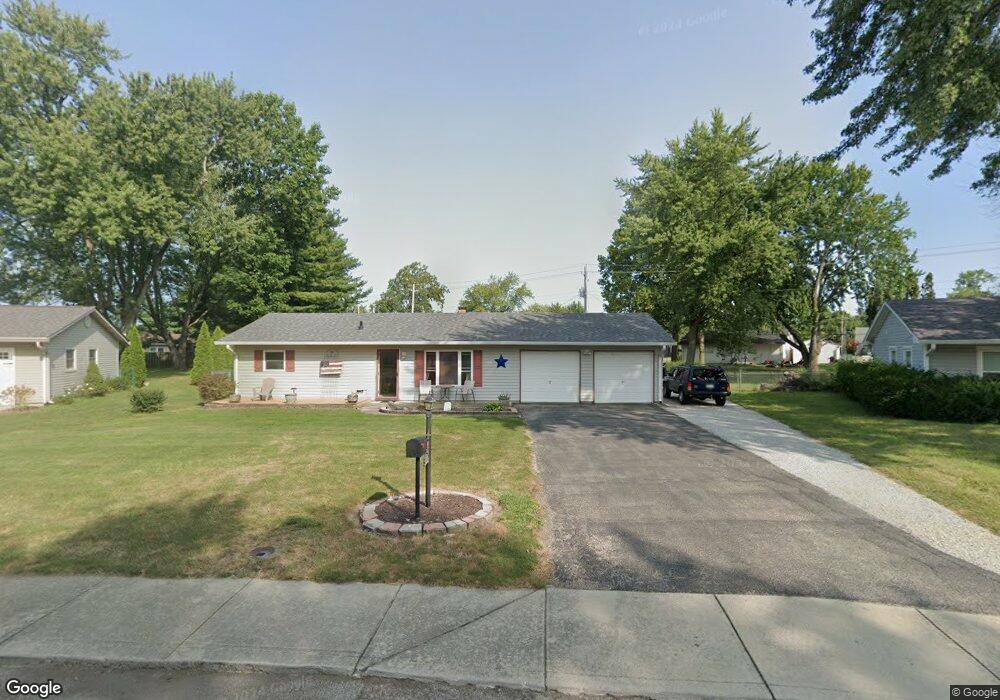
620 W Michigan St Greenfield, IN 46140
Estimated Value: $209,000 - $234,155
3
Beds
2
Baths
1,152
Sq Ft
$190/Sq Ft
Est. Value
About This Home
This home is located at 620 W Michigan St, Greenfield, IN 46140 and is currently estimated at $218,539, approximately $189 per square foot. 620 W Michigan St is a home located in Hancock County with nearby schools including Greenfield Intermediate School, Harris Elementary School, and Greenfield Central Junior High School.
Ownership History
Date
Name
Owned For
Owner Type
Purchase Details
Closed on
Apr 15, 2015
Sold by
Harsin Lori A
Bought by
Harsin Lori A and Smoth Connor D
Current Estimated Value
Purchase Details
Closed on
Mar 16, 2010
Sold by
Smith Etha Sue
Bought by
Harsin Lori A and Harsin Ronald D
Home Financials for this Owner
Home Financials are based on the most recent Mortgage that was taken out on this home.
Original Mortgage
$85,050
Interest Rate
5.1%
Mortgage Type
New Conventional
Create a Home Valuation Report for This Property
The Home Valuation Report is an in-depth analysis detailing your home's value as well as a comparison with similar homes in the area
Home Values in the Area
Average Home Value in this Area
Purchase History
| Date | Buyer | Sale Price | Title Company |
|---|---|---|---|
| Harsin Lori A | -- | None Available | |
| Harsin Lori A | -- | -- |
Source: Public Records
Mortgage History
| Date | Status | Borrower | Loan Amount |
|---|---|---|---|
| Previous Owner | Harsin Lori A | $85,050 |
Source: Public Records
Tax History Compared to Growth
Tax History
| Year | Tax Paid | Tax Assessment Tax Assessment Total Assessment is a certain percentage of the fair market value that is determined by local assessors to be the total taxable value of land and additions on the property. | Land | Improvement |
|---|---|---|---|---|
| 2024 | $1,649 | $193,400 | $40,000 | $153,400 |
| 2023 | $1,649 | $174,700 | $40,000 | $134,700 |
| 2022 | $1,301 | $143,100 | $25,200 | $117,900 |
| 2021 | $942 | $116,300 | $25,200 | $91,100 |
| 2020 | $877 | $109,500 | $25,200 | $84,300 |
| 2019 | $803 | $102,800 | $25,200 | $77,600 |
| 2018 | $799 | $101,000 | $25,200 | $75,800 |
| 2017 | $807 | $99,400 | $25,200 | $74,200 |
| 2016 | $818 | $96,800 | $24,300 | $72,500 |
| 2014 | $847 | $94,300 | $24,500 | $69,800 |
| 2013 | $847 | $91,500 | $24,500 | $67,000 |
Source: Public Records
Map
Nearby Homes
- 1571 N Creekwater Pass
- 603 Grandison Rd
- 811 N Noble St
- Harmony Plan at Brunson's Landing
- Stamford Plan at Brunson's Landing
- Chatham Plan at Brunson's Landing
- Aldridge Plan at Brunson's Landing
- Freeport Plan at Brunson's Landing
- Henley Plan at Brunson's Landing
- Bellamy Plan at Brunson's Landing
- 873 Rosebud Ln
- 618 Firefly Ct
- 1215 Simms Ln
- 1145 Phillips Dr
- 1207 Mcbride St
- 705 Wilson St
- 1228 Mcbride St
- 1307 Fleming Dr
- 6608 W Shoreline Ct
- 6507 W Whispering Way
- 1028 N Michigan St
- 707 W Mckenzie Rd
- 703 W Mckenzie Rd
- 711 W Mckenzie Rd
- 1107 N Broadway St
- 615 W Mckenzie Rd
- 1103 N Broadway St
- 1111 N Broadway St
- 612 W Michigan St
- 615 W Michigan St
- 1027 N Broadway St
- 715 W Mckenzie Rd
- 1020 N Michigan St
- 611 W Mckenzie Rd
- 1019 N Michigan St
- 1023 N Broadway St
- 608 W Michigan St
- 611 W Michigan St
- 1201 Fairview Dr
- 736 W Mckenzie Rd