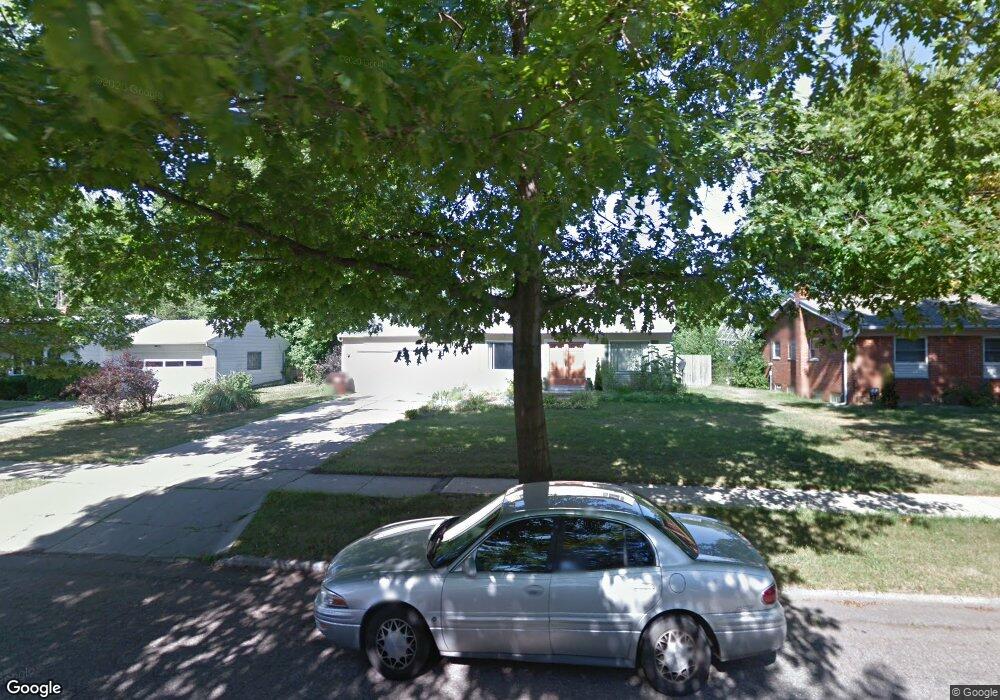
6200 Lerner Way Lansing, MI 48911
South Lansing NeighborhoodEstimated Value: $203,000 - $245,000
4
Beds
2
Baths
1,584
Sq Ft
$143/Sq Ft
Est. Value
About This Home
This home is located at 6200 Lerner Way, Lansing, MI 48911 and is currently estimated at $225,940, approximately $142 per square foot. 6200 Lerner Way is a home located in Ingham County with nearby schools including Forest View School, Attwood School, and Everett High School.
Ownership History
Date
Name
Owned For
Owner Type
Purchase Details
Closed on
Nov 16, 2006
Sold by
Miranda Raymond A and Miranda Carmen
Bought by
Wm Specialty Mortgage Llc
Current Estimated Value
Purchase Details
Closed on
May 29, 2002
Sold by
Howard Wilbur D
Bought by
Miranda Raymond A and Miranda Carmen
Home Financials for this Owner
Home Financials are based on the most recent Mortgage that was taken out on this home.
Original Mortgage
$121,500
Interest Rate
9.5%
Mortgage Type
Purchase Money Mortgage
Purchase Details
Closed on
Dec 14, 1994
Sold by
Howard Wilbur D and Howard Marjean C
Bought by
Howard Wilbur D
Create a Home Valuation Report for This Property
The Home Valuation Report is an in-depth analysis detailing your home's value as well as a comparison with similar homes in the area
Home Values in the Area
Average Home Value in this Area
Purchase History
| Date | Buyer | Sale Price | Title Company |
|---|---|---|---|
| Wm Specialty Mortgage Llc | $158,640 | None Available | |
| Miranda Raymond A | $135,000 | -- | |
| Howard Wilbur D | -- | -- |
Source: Public Records
Mortgage History
| Date | Status | Borrower | Loan Amount |
|---|---|---|---|
| Previous Owner | Miranda Raymond A | $121,500 |
Source: Public Records
Tax History Compared to Growth
Tax History
| Year | Tax Paid | Tax Assessment Tax Assessment Total Assessment is a certain percentage of the fair market value that is determined by local assessors to be the total taxable value of land and additions on the property. | Land | Improvement |
|---|---|---|---|---|
| 2025 | $3,420 | $104,600 | $11,900 | $92,700 |
| 2024 | $27 | $81,900 | $11,900 | $70,000 |
| 2023 | $3,206 | $74,500 | $11,900 | $62,600 |
| 2022 | $2,889 | $64,300 | $11,900 | $52,400 |
| 2021 | $2,829 | $62,000 | $8,700 | $53,300 |
| 2020 | $2,812 | $58,800 | $8,700 | $50,100 |
| 2019 | $2,696 | $55,000 | $8,700 | $46,300 |
| 2018 | $2,526 | $50,500 | $8,700 | $41,800 |
| 2017 | $2,418 | $50,500 | $8,700 | $41,800 |
| 2016 | $2,313 | $44,600 | $8,700 | $35,900 |
| 2015 | $2,313 | $42,700 | $17,439 | $25,261 |
| 2014 | $2,313 | $41,200 | $25,366 | $15,834 |
Source: Public Records
Map
Nearby Homes
- 6223 Beechfield Dr Unit 8
- 6309 Beechfield Dr Unit 45
- 6347 Beechfield Dr
- 6300 Beechfield Dr Unit 87
- 6704 Mill Stream Ln
- 4502 Bowline Ct
- 4485 Helmsway Dr
- 2702 Yachtsman Dr
- 1516 Cedarview Ln
- 6815 Aurelius Rd
- 2670 Brigantine Dr
- 5808 Orchard Ct
- 5750 Orchard Ct
- 5724 Orchard Ct
- 7011 Aurelius Rd
- 7061 W Bickett Blvd
- 354 E Miller Rd
- 4434 Willoughby Rd
- 2564 Winterberry St Unit 12
- 4348 Norway St
- 6210 Lerner Way
- 6144 Lerner Way
- 6205 Marscot Dr
- 6211 Marscot Dr
- 6145 Marscot Dr
- 6218 Lerner Way
- 6136 Lerner Way
- 6201 Lerner Way
- 6145 Lerner Way
- 6211 Lerner Way
- 6219 Marscot Dr
- 6137 Marscot Dr
- 6224 Lerner Way
- 6219 Lerner Way
- 6137 Lerner Way
- 6130 Lerner Way
- 6225 Marscot Dr
- 6129 Marscot Dr
- 6200 Marscot Dr
- 6225 Lerner Way