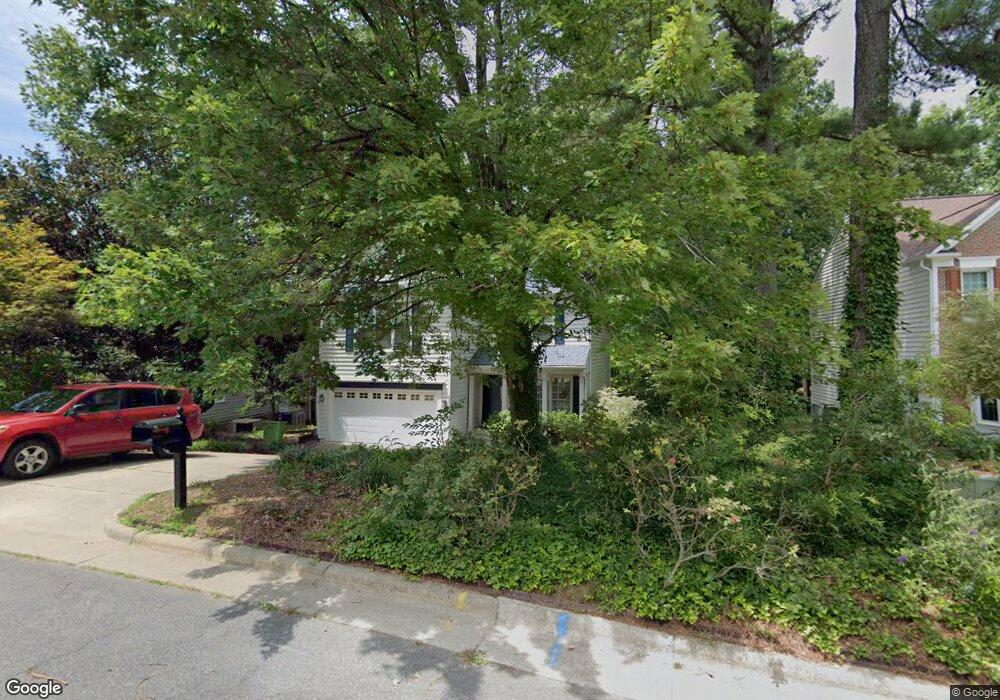
6205 Brielson Place Raleigh, NC 27616
Northeast Raleigh NeighborhoodEstimated Value: $391,421 - $437,000
3
Beds
3
Baths
1,815
Sq Ft
$224/Sq Ft
Est. Value
About This Home
This home is located at 6205 Brielson Place, Raleigh, NC 27616 and is currently estimated at $407,105, approximately $224 per square foot. 6205 Brielson Place is a home located in Wake County with nearby schools including Fox Road Elementary School, Wake Forest-Rolesville Middle School, and Wakefield High School.
Ownership History
Date
Name
Owned For
Owner Type
Purchase Details
Closed on
Apr 29, 2019
Sold by
Knauf Andrew M and Knauf Diane Elizabeth
Bought by
Stoner John C
Current Estimated Value
Home Financials for this Owner
Home Financials are based on the most recent Mortgage that was taken out on this home.
Original Mortgage
$238,090
Outstanding Balance
$209,750
Interest Rate
4.3%
Mortgage Type
New Conventional
Estimated Equity
$197,355
Purchase Details
Closed on
May 23, 2008
Sold by
Hirasaki Ken and Hirasaki Thipyaprapa
Bought by
Knauf Andrew M and Knauf Diane Elizabeth
Home Financials for this Owner
Home Financials are based on the most recent Mortgage that was taken out on this home.
Original Mortgage
$177,650
Interest Rate
5.84%
Mortgage Type
Purchase Money Mortgage
Purchase Details
Closed on
May 30, 2003
Sold by
Abraham William Frayer and Abraham Amanda M
Bought by
Hirasaki Ken and Hirasaki Thipyaprapa
Home Financials for this Owner
Home Financials are based on the most recent Mortgage that was taken out on this home.
Original Mortgage
$163,209
Interest Rate
5.79%
Mortgage Type
FHA
Create a Home Valuation Report for This Property
The Home Valuation Report is an in-depth analysis detailing your home's value as well as a comparison with similar homes in the area
Home Values in the Area
Average Home Value in this Area
Purchase History
| Date | Buyer | Sale Price | Title Company |
|---|---|---|---|
| Stoner John C | $247,000 | None Available | |
| Knauf Andrew M | $187,000 | None Available | |
| Hirasaki Ken | $164,500 | -- |
Source: Public Records
Mortgage History
| Date | Status | Borrower | Loan Amount |
|---|---|---|---|
| Open | Stoner John C | $238,090 | |
| Previous Owner | Knauf Andrew M | $177,650 | |
| Previous Owner | Hirasaki Ken | $163,209 |
Source: Public Records
Tax History Compared to Growth
Tax History
| Year | Tax Paid | Tax Assessment Tax Assessment Total Assessment is a certain percentage of the fair market value that is determined by local assessors to be the total taxable value of land and additions on the property. | Land | Improvement |
|---|---|---|---|---|
| 2025 | $3,549 | $404,679 | $100,000 | $304,679 |
| 2024 | $3,535 | $404,679 | $100,000 | $304,679 |
| 2023 | $2,746 | $250,079 | $48,000 | $202,079 |
| 2022 | $2,552 | $250,079 | $48,000 | $202,079 |
| 2021 | $2,453 | $250,079 | $48,000 | $202,079 |
| 2020 | $2,409 | $250,079 | $48,000 | $202,079 |
| 2019 | $2,095 | $179,058 | $40,000 | $139,058 |
| 2018 | $1,976 | $179,058 | $40,000 | $139,058 |
| 2017 | $1,883 | $179,058 | $40,000 | $139,058 |
| 2016 | $1,844 | $179,058 | $40,000 | $139,058 |
| 2015 | $2,044 | $195,416 | $50,000 | $145,416 |
| 2014 | $1,939 | $195,416 | $50,000 | $145,416 |
Source: Public Records
Map
Nearby Homes
- 4804 Red Coat Ct
- 4804 Sinclair Dr
- 6305 Musket Ball Ct
- 6205 Remington Lake Dr
- 4905 Will-O-dean Rd
- 5208 Botany Bay Dr
- 5223 Botany Bay Dr
- 5946 Kohler Ln
- 6016 Four Townes Ln
- 7026 Jeffreys Creek Ln
- 6923 Fox Haven Place
- 2873 Springtooth Dr
- 7317 Fox Rd
- 5708 Sea Fox Ct
- 7205 Beaverwood Dr
- 4804 Spring Forest Rd
- 7313 Jacqueline Ln
- 6633 Professor St
- 4809 Hallam Way
- 4420 Archibald Way
- 6201 Brielson Place
- 6213 Brielson Place
- 6231 Stadler Dr
- 6235 Stadler Dr
- 6204 Brielson Place
- 6300 Lymington Dr
- 6232 Stadler Dr
- 6200 Brielson Place
- 6304 Lymington Dr
- 6217 Brielson Place
- 4920 Bivens Dr
- 6208 Brielson Place
- 4924 Bivens Dr
- 6212 Brielson Place
- 6308 Lymington Dr
- 6216 Brielson Place
- 6602 Terrace Park Ct
- 4928 Bivens Dr
- 4912 Bivens Dr
- 4937 Bivens Dr