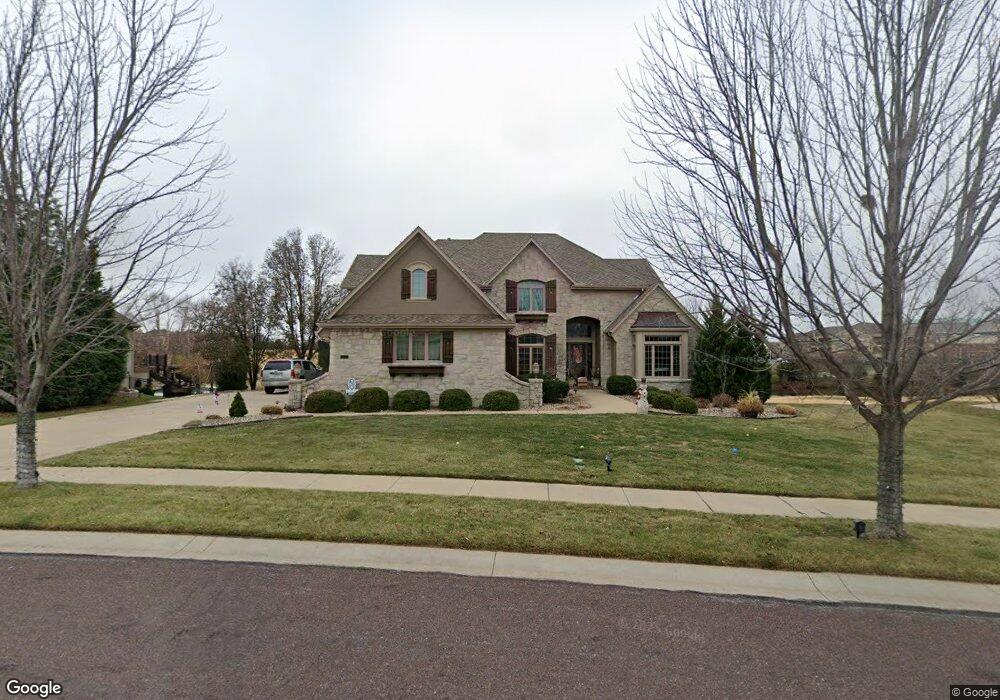
6209 W 138th St Overland Park, KS 66223
South Overland Park NeighborhoodEstimated Value: $1,106,000 - $1,344,000
7
Beds
7
Baths
4,049
Sq Ft
$304/Sq Ft
Est. Value
About This Home
This home is located at 6209 W 138th St, Overland Park, KS 66223 and is currently estimated at $1,232,315, approximately $304 per square foot. 6209 W 138th St is a home located in Johnson County with nearby schools including Overland Trail Elementary School, Overland Trail Middle School, and Blue Valley North High School.
Ownership History
Date
Name
Owned For
Owner Type
Purchase Details
Closed on
Feb 11, 2013
Sold by
Ulowetz John E and Ulowetz Kimberly
Bought by
John E Ulowetz Revocable Trust
Current Estimated Value
Purchase Details
Closed on
Apr 15, 2006
Sold by
Bedran Albert M and Bedran Wendy L
Bought by
Ulowetz John E and Ulowetz Kimberly
Home Financials for this Owner
Home Financials are based on the most recent Mortgage that was taken out on this home.
Original Mortgage
$417,000
Interest Rate
6.37%
Mortgage Type
New Conventional
Purchase Details
Closed on
May 7, 2004
Sold by
Bodine Ashner Builders Inc
Bought by
Bedran Albert M and Bedran Wendy L
Home Financials for this Owner
Home Financials are based on the most recent Mortgage that was taken out on this home.
Original Mortgage
$679,960
Interest Rate
3%
Mortgage Type
Purchase Money Mortgage
Purchase Details
Closed on
Nov 22, 2001
Sold by
Lionsgate Golf Developers Llc
Bought by
Bodine Ashner Builders Inc
Create a Home Valuation Report for This Property
The Home Valuation Report is an in-depth analysis detailing your home's value as well as a comparison with similar homes in the area
Home Values in the Area
Average Home Value in this Area
Purchase History
| Date | Buyer | Sale Price | Title Company |
|---|---|---|---|
| John E Ulowetz Revocable Trust | -- | None Available | |
| Ulowetz John E | -- | Accommodation | |
| Bedran Albert M | -- | Security Land Title Company | |
| Bodine Ashner Builders Inc | -- | Security Land Title Company |
Source: Public Records
Mortgage History
| Date | Status | Borrower | Loan Amount |
|---|---|---|---|
| Previous Owner | Ulowetz John E | $417,000 | |
| Previous Owner | Bedran Albert M | $679,960 |
Source: Public Records
Tax History Compared to Growth
Tax History
| Year | Tax Paid | Tax Assessment Tax Assessment Total Assessment is a certain percentage of the fair market value that is determined by local assessors to be the total taxable value of land and additions on the property. | Land | Improvement |
|---|---|---|---|---|
| 2024 | $14,195 | $136,781 | $35,926 | $100,855 |
| 2023 | $12,705 | $121,291 | $35,926 | $85,365 |
| 2022 | $12,414 | $116,369 | $35,926 | $80,443 |
| 2021 | $11,953 | $106,871 | $31,231 | $75,640 |
| 2020 | $11,623 | $103,190 | $25,979 | $77,211 |
| 2019 | $11,758 | $102,178 | $22,598 | $79,580 |
| 2018 | $11,723 | $99,844 | $22,598 | $77,246 |
| 2017 | $11,735 | $98,142 | $22,598 | $75,544 |
| 2016 | $11,089 | $92,668 | $22,598 | $70,070 |
| 2015 | $11,127 | $92,518 | $22,598 | $69,920 |
| 2013 | -- | $88,551 | $22,598 | $65,953 |
Source: Public Records
Map
Nearby Homes
- 5804 Golden Bear Dr
- 5605 Golden Bear Dr
- 4411 W 136th Terrace
- 14008 Outlook St
- 14005 Nicklaus Dr
- 6416 W 134th St
- 6407 W 133rd Terrace
- 3260 W 133rd Terrace
- 3344 W 133rd Terrace
- 2760 W 133rd Terrace
- 2756 W 133rd Terrace
- 2840 W 133rd Terrace
- 2844 W 133rd Terrace
- 3352 W 133rd Terrace
- 3248 W 133rd Terrace
- 2846 W 133rd Terrace
- 2852 W 133rd Terrace
- 2860 W 133rd Terrace
- 2856 W 133rd Terrace
- 3444 W 133rd Terrace
- 6213 W 138th St
- 6205 W 138th St
- 6204 W 138th St
- 6200 W 138th St
- 6201 W 138th St
- 6217 W 138th St
- 13812 Horton Dr
- 6208 W 138th St
- 13808 Horton Dr
- 13732 Horton Dr
- 6212 W 138th St
- 13728 Horton Dr
- 13816 Horton Dr
- 13801 Horton Dr
- 13737 Horton Dr
- 13805 Horton Dr
- 13733 Horton Dr
- 13724 Horton Dr
- 13809 Horton Dr
- 13729 Horton Dr