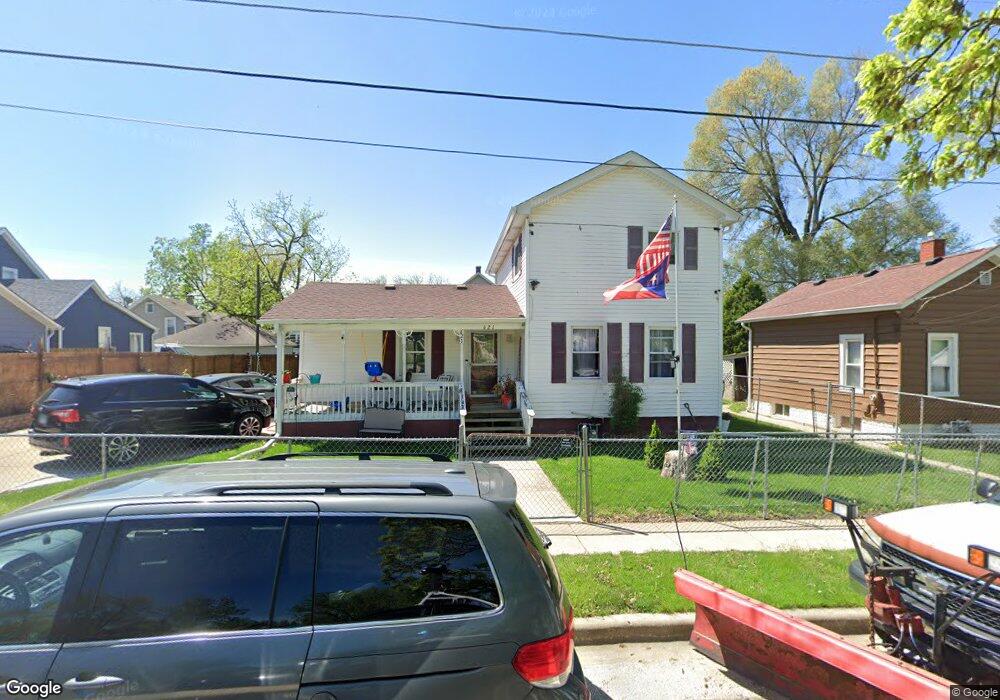
621 Flagg St Aurora, IL 60505
McCarty Burlington NeighborhoodEstimated Value: $224,665 - $254,000
4
Beds
1
Bath
1,308
Sq Ft
$183/Sq Ft
Est. Value
About This Home
This home is located at 621 Flagg St, Aurora, IL 60505 and is currently estimated at $239,666, approximately $183 per square foot. 621 Flagg St is a home located in Kane County with nearby schools including Brady Elementary School, Simmons Middle School, and East Aurora High School.
Ownership History
Date
Name
Owned For
Owner Type
Purchase Details
Closed on
Sep 13, 2007
Sold by
Rivera Maria
Bought by
Soto Heriberto and Soto Amada
Current Estimated Value
Purchase Details
Closed on
Dec 20, 1996
Sold by
Desimone John
Bought by
Rivera Maria
Home Financials for this Owner
Home Financials are based on the most recent Mortgage that was taken out on this home.
Original Mortgage
$68,916
Interest Rate
7.6%
Mortgage Type
FHA
Purchase Details
Closed on
Apr 29, 1996
Sold by
Johnson Athelia
Bought by
Desimone John
Create a Home Valuation Report for This Property
The Home Valuation Report is an in-depth analysis detailing your home's value as well as a comparison with similar homes in the area
Home Values in the Area
Average Home Value in this Area
Purchase History
| Date | Buyer | Sale Price | Title Company |
|---|---|---|---|
| Soto Heriberto | -- | Chicago Title Insurance Co | |
| Rivera Maria | $69,000 | Law Title Insurance Co Inc | |
| Desimone John | $20,500 | Law Title Insurance Co Inc |
Source: Public Records
Mortgage History
| Date | Status | Borrower | Loan Amount |
|---|---|---|---|
| Previous Owner | Rivera Maria | $68,916 | |
| Closed | Desimone John | $0 |
Source: Public Records
Tax History
| Year | Tax Paid | Tax Assessment Tax Assessment Total Assessment is a certain percentage of the fair market value that is determined by local assessors to be the total taxable value of land and additions on the property. | Land | Improvement |
|---|---|---|---|---|
| 2024 | $2,964 | $51,239 | $9,057 | $42,182 |
| 2023 | $2,823 | $45,781 | $8,092 | $37,689 |
| 2022 | $2,718 | $41,771 | $7,383 | $34,388 |
| 2021 | $2,655 | $38,890 | $6,874 | $32,016 |
| 2020 | $2,505 | $36,123 | $6,385 | $29,738 |
| 2019 | $2,420 | $33,469 | $5,916 | $27,553 |
| 2018 | $2,165 | $29,779 | $5,472 | $24,307 |
| 2017 | $2,115 | $27,567 | $5,042 | $22,525 |
| 2016 | $1,903 | $24,081 | $4,322 | $19,759 |
| 2015 | -- | $21,364 | $3,717 | $17,647 |
| 2014 | -- | $20,873 | $3,416 | $17,457 |
| 2013 | -- | $22,037 | $3,264 | $18,773 |
Source: Public Records
Map
Nearby Homes