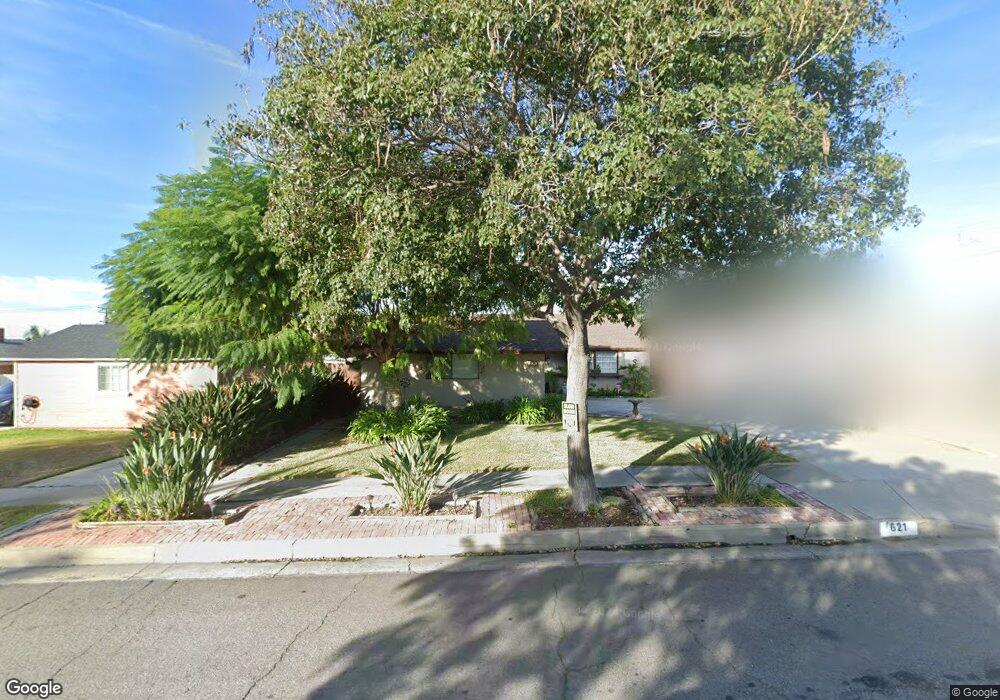
621 Lemon St La Habra, CA 90631
Estimated Value: $785,000 - $808,000
3
Beds
1
Bath
1,125
Sq Ft
$711/Sq Ft
Est. Value
About This Home
This home is located at 621 Lemon St, La Habra, CA 90631 and is currently estimated at $799,353, approximately $710 per square foot. 621 Lemon St is a home located in Orange County with nearby schools including Arbolita Elementary School, El Cerrito Elementary School, and Washington Middle School.
Ownership History
Date
Name
Owned For
Owner Type
Purchase Details
Closed on
Oct 30, 2009
Sold by
Lemon Trust #621
Bought by
Salazar Maria F
Current Estimated Value
Home Financials for this Owner
Home Financials are based on the most recent Mortgage that was taken out on this home.
Original Mortgage
$309,600
Outstanding Balance
$202,053
Interest Rate
4.99%
Mortgage Type
New Conventional
Estimated Equity
$597,300
Purchase Details
Closed on
Aug 12, 2009
Sold by
Bradley Chancey
Bought by
Lemon Trust #621 and Galileo Financial
Purchase Details
Closed on
Jun 27, 2007
Sold by
Bradley Chancey
Bought by
Wilmarth Robert James and Acosta Tammy Lisa
Purchase Details
Closed on
Nov 4, 2005
Sold by
Kreiger Barbara
Bought by
Bradley Chancey
Home Financials for this Owner
Home Financials are based on the most recent Mortgage that was taken out on this home.
Original Mortgage
$404,000
Interest Rate
7.12%
Mortgage Type
Purchase Money Mortgage
Create a Home Valuation Report for This Property
The Home Valuation Report is an in-depth analysis detailing your home's value as well as a comparison with similar homes in the area
Home Values in the Area
Average Home Value in this Area
Purchase History
| Date | Buyer | Sale Price | Title Company |
|---|---|---|---|
| Salazar Maria F | $344,000 | First American Title Company | |
| Lemon Trust #621 | -- | None Available | |
| Wilmarth Robert James | -- | None Available | |
| Bradley Chancey | $505,000 | California Counties Title Co |
Source: Public Records
Mortgage History
| Date | Status | Borrower | Loan Amount |
|---|---|---|---|
| Open | Salazar Maria F | $309,600 | |
| Previous Owner | Bradley Chancey | $404,000 |
Source: Public Records
Tax History Compared to Growth
Tax History
| Year | Tax Paid | Tax Assessment Tax Assessment Total Assessment is a certain percentage of the fair market value that is determined by local assessors to be the total taxable value of land and additions on the property. | Land | Improvement |
|---|---|---|---|---|
| 2025 | $5,045 | $444,037 | $380,346 | $63,691 |
| 2024 | $5,045 | $435,331 | $372,888 | $62,443 |
| 2023 | $4,928 | $426,796 | $365,577 | $61,219 |
| 2022 | $4,875 | $418,428 | $358,409 | $60,019 |
| 2021 | $4,795 | $410,224 | $351,381 | $58,843 |
| 2020 | $4,749 | $406,018 | $347,778 | $58,240 |
| 2019 | $4,617 | $398,057 | $340,958 | $57,099 |
| 2018 | $4,538 | $390,252 | $334,272 | $55,980 |
| 2017 | $4,456 | $382,600 | $327,717 | $54,883 |
| 2016 | $4,350 | $375,099 | $321,292 | $53,807 |
| 2015 | $4,225 | $369,465 | $316,466 | $52,999 |
| 2014 | $3,744 | $328,800 | $279,452 | $49,348 |
Source: Public Records
Map
Nearby Homes
- Plan 4 - The Sage at The Birchwoods
- Plan 2 - The Poppy at The Birchwoods
- 760 N Orange St
- 762 N Orange St
- 764 N Orange St
- 766 N Orange St
- 770 N Orange St
- 994 E La Habra Blvd Unit 246
- 570 E 2nd Ave
- 1100 N Euclid St
- 1018 E La Habra Blvd Unit 238
- 308 S Valencia St
- 950 N Walnut St
- 303 S Cadiz Ct
- 313 W 1st Ave Unit M
- 1400 Eastpark Dr
- 581 W Greenwood Ave Unit 6
- 410 N Fonda St
- 220 Olinda Ave
- 1241 Arbolita Dr
- 631 Lemon St
- 611 Lemon St
- 620 N Cypress St
- 601 Lemon St
- 630 N Cypress St
- 610 N Cypress St
- 430 E Pinehurst Ave
- 420 E Pinehurst Ave
- 600 N Cypress St
- 410 E Pinehurst Ave
- 620 Lemon St
- 630 Lemon St
- 610 Lemon St
- 400 E Pinehurst Ave
- 500 E Pinehurst Ave
- 551 Lemon St
- 550 N Cypress St
- 600 Lemon St
- 510 E Pinehurst Ave
- 550 Lemon St