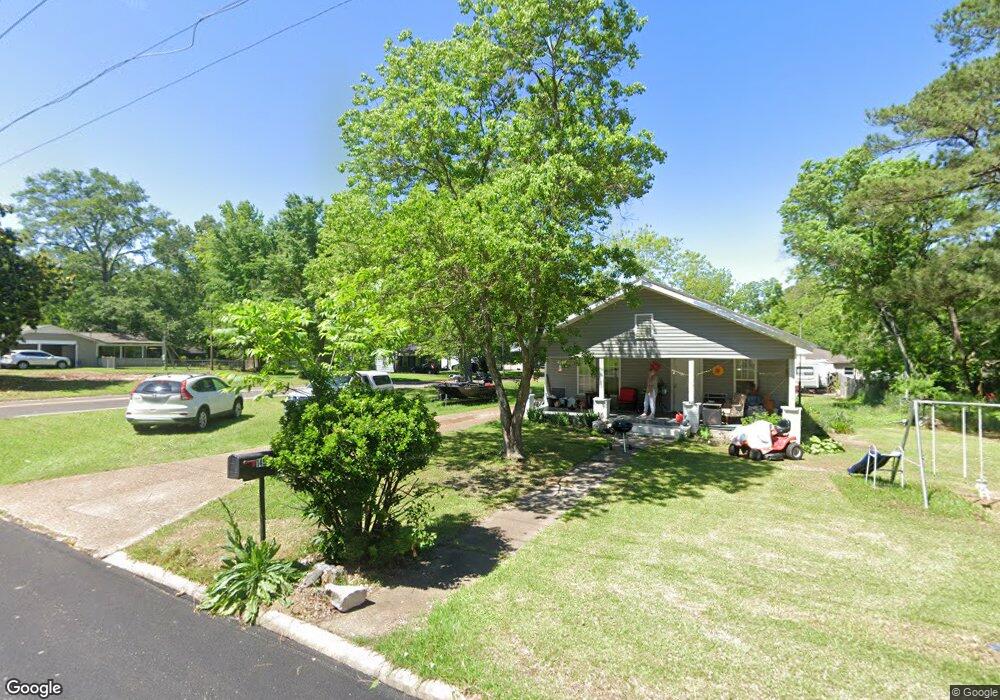
621 Mccord St West Point, MS 39773
Estimated Value: $112,000 - $128,000
3
Beds
--
Bath
1,355
Sq Ft
$87/Sq Ft
Est. Value
About This Home
This home is located at 621 Mccord St, West Point, MS 39773 and is currently estimated at $118,472, approximately $87 per square foot. 621 Mccord St is a home located in Clay County with nearby schools including East Side Elementary School, West Clay Elementary School, and Church Hill Elementary School.
Ownership History
Date
Name
Owned For
Owner Type
Purchase Details
Closed on
Jun 1, 2021
Sold by
Thomas Aundra and Thomas Shirley Grace
Bought by
Davenport Gertrude
Current Estimated Value
Purchase Details
Closed on
Jun 7, 2018
Sold by
Pearson Patricia Richardson and Richardson Johnnie
Bought by
Johnson Tanya and Qualls Derrick
Purchase Details
Closed on
Oct 30, 2007
Sold by
Pearson George Payne and Pearson Buraleen H
Bought by
Nix George Burton and Hall Nix Charlotte Ann
Create a Home Valuation Report for This Property
The Home Valuation Report is an in-depth analysis detailing your home's value as well as a comparison with similar homes in the area
Home Values in the Area
Average Home Value in this Area
Purchase History
| Date | Buyer | Sale Price | Title Company |
|---|---|---|---|
| Davenport Gertrude | -- | None Available | |
| Johnson Tanya | -- | -- | |
| Nix George Burton | -- | -- |
Source: Public Records
Tax History Compared to Growth
Tax History
| Year | Tax Paid | Tax Assessment Tax Assessment Total Assessment is a certain percentage of the fair market value that is determined by local assessors to be the total taxable value of land and additions on the property. | Land | Improvement |
|---|---|---|---|---|
| 2024 | $589 | $10,869 | $2,441 | $8,428 |
| 2023 | $1,358 | $9,075 | $2,441 | $6,634 |
| 2022 | $495 | $9,075 | $2,441 | $6,634 |
| 2021 | $493 | $9,075 | $2,441 | $6,634 |
| 2020 | $493 | $9,075 | $2,441 | $6,634 |
| 2019 | $466 | $9,014 | $2,441 | $6,573 |
| 2018 | $446 | $9,014 | $2,441 | $6,573 |
| 2017 | $446 | $9,014 | $2,441 | $6,573 |
| 2016 | $429 | $9,014 | $2,441 | $6,573 |
| 2015 | $410 | $8,328 | $2,441 | $5,887 |
| 2014 | $241 | $8,328 | $2,441 | $5,887 |
| 2013 | $241 | $8,328 | $2,441 | $5,887 |
Source: Public Records
Map
Nearby Homes
- 472 S Eshman Ave
- 1046 E Brame Ave
- 44 Torbert Dr
- 164 Belvedere Ave
- 278 Converse Dr
- 329 Converse Dr
- 15 David St
- 551 E Westbrook St
- 1180 E Broad St
- 480 E Westbrook St
- 485 E Westbrook St
- 479 E Westbrook St
- 1153 E Broad St
- 1104 E Broad St
- 238 Calhoun St
- 26596 E Main St
- 27045 E Main St
- 27445 E Main St
- 402 Cromwell St
- 26852 E Main St