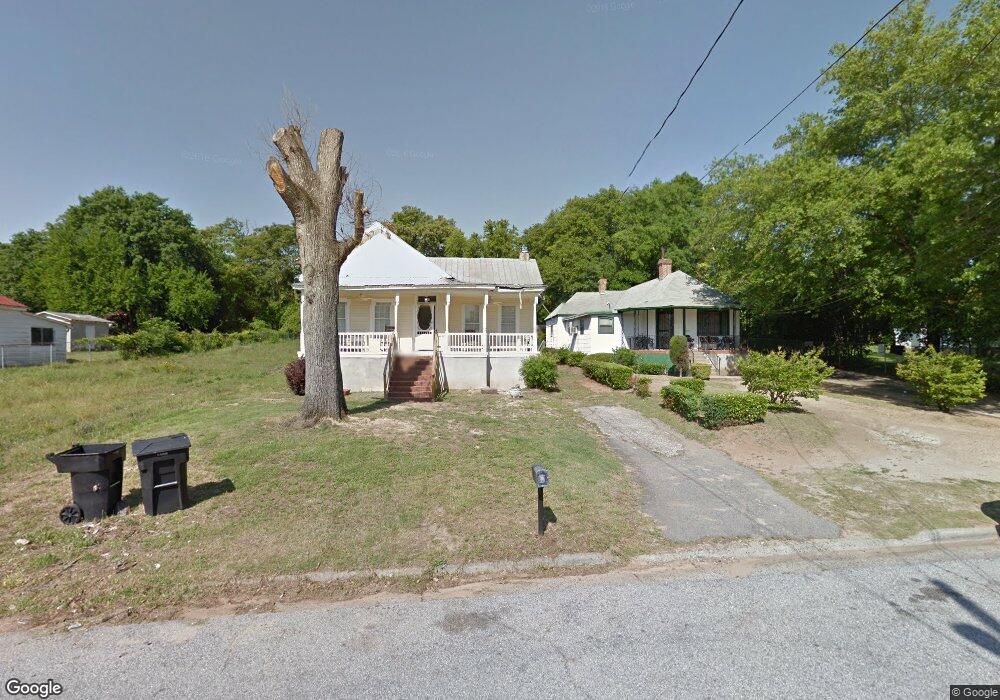
621 Montgomery St Augusta, GA 30904
Sand Hills NeighborhoodEstimated Value: $130,000 - $183,000
3
Beds
2
Baths
1,652
Sq Ft
$92/Sq Ft
Est. Value
About This Home
This home is located at 621 Montgomery St, Augusta, GA 30904 and is currently estimated at $151,995, approximately $92 per square foot. 621 Montgomery St is a home located in Richmond County with nearby schools including First Coast Technical Institute, R.B. Hunt Elementary School, and A. Brian Merry Elementary School.
Ownership History
Date
Name
Owned For
Owner Type
Purchase Details
Closed on
Jan 8, 2013
Sold by
Woolridge Oster A
Bought by
Woolridge Jo Ann K
Current Estimated Value
Purchase Details
Closed on
Dec 15, 2009
Sold by
Kelly John L
Bought by
Woolrige Oster A and Woolrige Joann
Purchase Details
Closed on
Aug 5, 2003
Sold by
Kelly John L
Bought by
Woolridge Joann and Woolridge Oster A
Home Financials for this Owner
Home Financials are based on the most recent Mortgage that was taken out on this home.
Original Mortgage
$15,750
Interest Rate
10%
Mortgage Type
Seller Take Back
Purchase Details
Closed on
Jan 17, 2003
Sold by
Kdk Associates Inc
Bought by
Kelly John L
Purchase Details
Closed on
Jan 13, 2003
Sold by
Screen Robert Martin
Bought by
Kdk Associates Inc
Purchase Details
Closed on
Aug 31, 1995
Sold by
Mckinney Lena Marti
Bought by
Screen Robert Marti
Create a Home Valuation Report for This Property
The Home Valuation Report is an in-depth analysis detailing your home's value as well as a comparison with similar homes in the area
Home Values in the Area
Average Home Value in this Area
Purchase History
| Date | Buyer | Sale Price | Title Company |
|---|---|---|---|
| Woolridge Jo Ann K | -- | -- | |
| Woolrige Oster A | $17,500 | -- | |
| Woolridge Joann | $17,500 | -- | |
| Kelly John L | $10,000 | -- | |
| Kdk Associates Inc | $5,000 | -- | |
| Screen Robert Marti | -- | -- |
Source: Public Records
Mortgage History
| Date | Status | Borrower | Loan Amount |
|---|---|---|---|
| Previous Owner | Woolridge Joann | $15,750 |
Source: Public Records
Tax History Compared to Growth
Tax History
| Year | Tax Paid | Tax Assessment Tax Assessment Total Assessment is a certain percentage of the fair market value that is determined by local assessors to be the total taxable value of land and additions on the property. | Land | Improvement |
|---|---|---|---|---|
| 2025 | $503 | $42,752 | $4,100 | $38,652 |
| 2024 | $503 | $44,608 | $4,100 | $40,508 |
| 2023 | $321 | $50,264 | $4,100 | $46,164 |
| 2022 | $311 | $35,371 | $4,100 | $31,271 |
| 2021 | $311 | $26,751 | $4,100 | $22,651 |
| 2020 | $311 | $26,751 | $4,100 | $22,651 |
| 2019 | $311 | $26,751 | $4,100 | $22,651 |
| 2018 | $311 | $26,751 | $4,100 | $22,651 |
| 2017 | $311 | $26,751 | $4,100 | $22,651 |
| 2016 | $311 | $26,751 | $4,100 | $22,651 |
| 2015 | $312 | $26,751 | $4,100 | $22,651 |
| 2014 | $313 | $26,751 | $4,100 | $22,651 |
Source: Public Records
Map
Nearby Homes
- 627 Montgomery St
- 708 Weed St
- 710 Weed St
- 616 Weed St
- 2450 Wheeler Rd
- 2502 Porter St
- 532 Fleming Ave
- 526 Fleming Ave
- 2533 Wheeler Rd
- 2541 Wheeler Rd
- 2551 Mount Auburn St
- 732 Katherine St
- 2611 Hazel St
- 2204 Gardner St
- 1141 Arsenal Ave
- 2602 Walton Way
- 2213 Dartmouth Rd
- 2221 Edgewood Dr
- 904 Highland Ave
- 404 Brookside Ct
- 617 Montgomery St
- 607 Montgomery St
- 703 Montgomery St
- 0 Gardner St Unit 7134419
- 705 Montgomery St
- 620 Montgomery St
- 618 Montgomery St
- 618 Weed St
- 622 Montgomery St
- 616 Montgomery St
- 605 Montgomery St
- 698 Weed St
- 614 Montgomery St
- 608 Weed St
- 702 Montgomery St
- 2367 Gardner St
- 706 Weed St
- 2378 Fitten St
- 603 Montgomery St
- 2410 Fitten St