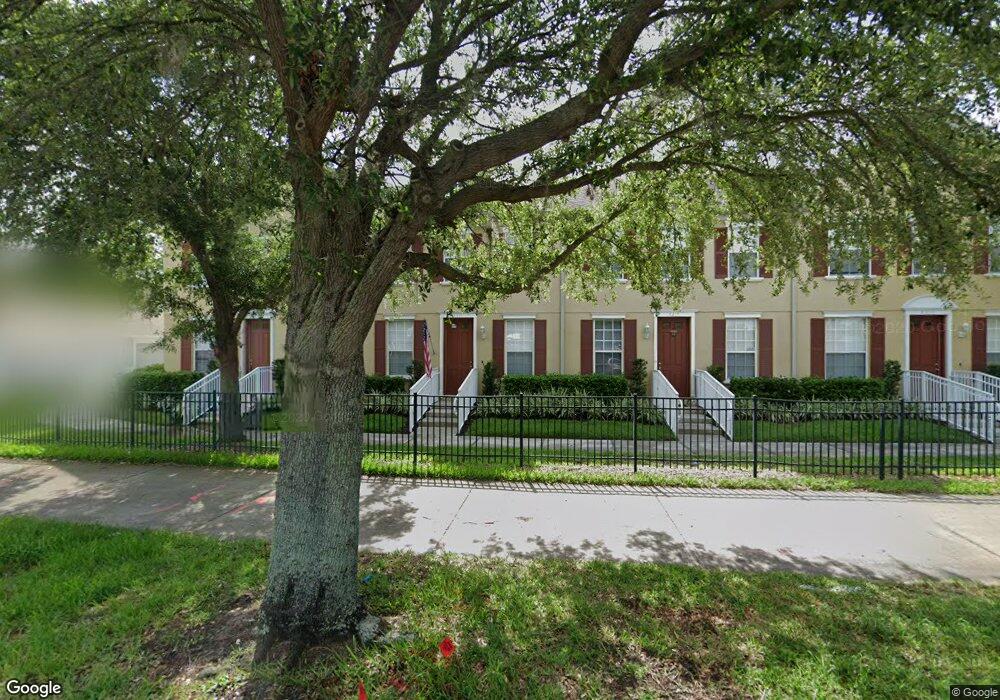
6211 S Chickasaw Trail Orlando, FL 32829
Lee Vista NeighborhoodEstimated Value: $310,000 - $332,106
3
Beds
3
Baths
2,244
Sq Ft
$145/Sq Ft
Est. Value
About This Home
This home is located at 6211 S Chickasaw Trail, Orlando, FL 32829 and is currently estimated at $324,527, approximately $144 per square foot. 6211 S Chickasaw Trail is a home located in Orange County with nearby schools including Vista Lakes Elementary, Odyssey Middle School, and Colonial High School.
Ownership History
Date
Name
Owned For
Owner Type
Purchase Details
Closed on
Sep 7, 2018
Sold by
Mason Ronald W and Mason Betty Sue
Bought by
Mason James Tyler and Lin Laura Adrienne
Current Estimated Value
Home Financials for this Owner
Home Financials are based on the most recent Mortgage that was taken out on this home.
Original Mortgage
$125,000
Outstanding Balance
$88,103
Interest Rate
4.8%
Mortgage Type
New Conventional
Estimated Equity
$236,424
Purchase Details
Closed on
Apr 29, 2013
Sold by
Engstrom James E
Bought by
Mason Ronald W and Mason Betty Sue
Purchase Details
Closed on
Dec 17, 2003
Sold by
Classic Townhomes Of Orlando Llc
Bought by
Engstrom James E
Home Financials for this Owner
Home Financials are based on the most recent Mortgage that was taken out on this home.
Original Mortgage
$119,200
Interest Rate
5.87%
Mortgage Type
Purchase Money Mortgage
Create a Home Valuation Report for This Property
The Home Valuation Report is an in-depth analysis detailing your home's value as well as a comparison with similar homes in the area
Home Values in the Area
Average Home Value in this Area
Purchase History
| Date | Buyer | Sale Price | Title Company |
|---|---|---|---|
| Mason James Tyler | -- | None Available | |
| Mason Ronald W | $125,000 | North American Title Company | |
| Engstrom James E | $149,100 | -- |
Source: Public Records
Mortgage History
| Date | Status | Borrower | Loan Amount |
|---|---|---|---|
| Open | Mason James Tyler | $125,000 | |
| Previous Owner | Engstrom James E | $119,200 | |
| Closed | Engstrom James E | $22,300 |
Source: Public Records
Tax History Compared to Growth
Tax History
| Year | Tax Paid | Tax Assessment Tax Assessment Total Assessment is a certain percentage of the fair market value that is determined by local assessors to be the total taxable value of land and additions on the property. | Land | Improvement |
|---|---|---|---|---|
| 2025 | $3,829 | $204,267 | -- | -- |
| 2024 | $3,460 | $204,267 | -- | -- |
| 2023 | $3,460 | $192,728 | $0 | $0 |
| 2022 | $3,330 | $187,115 | $0 | $0 |
| 2021 | $3,223 | $181,665 | $0 | $0 |
| 2020 | $3,069 | $179,157 | $0 | $0 |
| 2019 | $3,162 | $175,129 | $17,000 | $158,129 |
| 2018 | $3,648 | $170,970 | $17,000 | $153,970 |
| 2017 | $3,489 | $166,914 | $17,000 | $149,914 |
| 2016 | $3,209 | $137,450 | $17,000 | $120,450 |
| 2015 | $3,065 | $129,267 | $17,000 | $112,267 |
| 2014 | $2,758 | $103,195 | $17,000 | $86,195 |
Source: Public Records
Map
Nearby Homes
- 6280 Bristol Channel Way
- 6335 Westcott Cove Blvd
- 8630 Buccilli Dr Unit 309
- 8517 Saratoga Inlet Dr
- 6158 Lightner Dr
- 6166 Lightner Dr
- 6240 Contessa Dr Unit 101
- 6265 Contessa Dr Unit 101
- 6335 Contessa Dr Unit 104
- 6335 Contessa Dr Unit 205
- 6335 Contessa Dr Unit 301
- 8775 Sartori St Unit 307
- 6523 Lake Pembroke Place
- 5921 Lake Champlain Dr
- 6098 Crayfish Dr Unit 3230
- 5841 Lake Melrose Dr
- 8973 Lee Vista Blvd Unit 2308
- 8957 Lee Vista Blvd Unit 2502
- 8933 Lee Vista Blvd Unit 2609
- 8933 Lee Vista Blvd Unit 2610
- 6207 S Chickasaw Trail
- 6219 S Chickasaw Trail
- 6227 S Chickasaw Trail
- 6231 S Chickasaw Trail
- 6212 Bristol Channel Way
- 6216 Bristol Channel Way
- 6208 Bristol Channel Way
- 6204 Bristol Channel Way
- 6228 Westcott Cove Blvd
- 6224 Bristol Channel Way
- 6224 Bristol Channel Way Unit 6224
- 6234 Westcott Cove Blvd
- 6228 Bristol Channel Way
- 6240 Westcott Cove Blvd
- 6239 S Chickasaw Trail
- 6232 Bristol Channel Way
- 6246 Westcott Cove Blvd
- 6243 S Chickasaw Trail
- 6236 Bristol Channel Way
- 6252 Westcott Cove Blvd