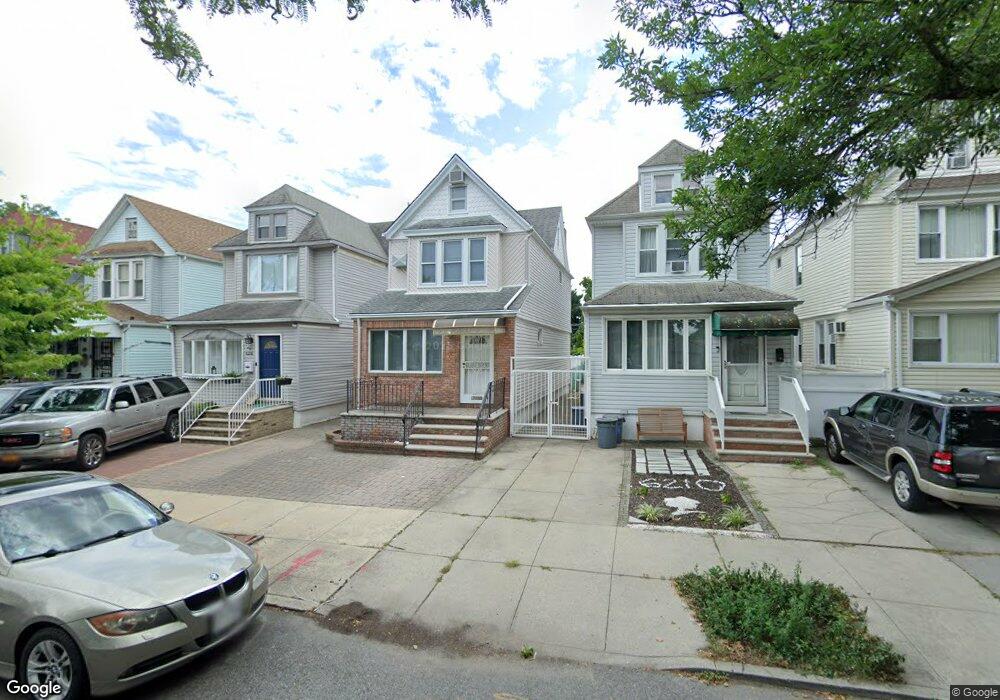
6212 80th Rd Ridgewood, NY 11385
Glendale NeighborhoodEstimated Value: $830,000 - $882,000
--
Bed
--
Bath
1,622
Sq Ft
$527/Sq Ft
Est. Value
About This Home
This home is located at 6212 80th Rd, Ridgewood, NY 11385 and is currently estimated at $855,536, approximately $527 per square foot. 6212 80th Rd is a home located in Queens County with nearby schools including P.S. 68 - Cambridge, Joseph F. Quinn Intermediate School 77, and Sacred Heart School.
Ownership History
Date
Name
Owned For
Owner Type
Purchase Details
Closed on
Nov 22, 2024
Sold by
Estate Of Caroline M Troisi and Mark Troisi As Administrator
Bought by
Melgar Luis O and Melgar Luis R
Current Estimated Value
Home Financials for this Owner
Home Financials are based on the most recent Mortgage that was taken out on this home.
Original Mortgage
$714,500
Outstanding Balance
$707,651
Interest Rate
6.32%
Mortgage Type
Purchase Money Mortgage
Estimated Equity
$147,885
Create a Home Valuation Report for This Property
The Home Valuation Report is an in-depth analysis detailing your home's value as well as a comparison with similar homes in the area
Home Values in the Area
Average Home Value in this Area
Purchase History
| Date | Buyer | Sale Price | Title Company |
|---|---|---|---|
| Melgar Luis O | $844,000 | -- |
Source: Public Records
Mortgage History
| Date | Status | Borrower | Loan Amount |
|---|---|---|---|
| Open | Melgar Luis O | $714,500 |
Source: Public Records
Tax History Compared to Growth
Tax History
| Year | Tax Paid | Tax Assessment Tax Assessment Total Assessment is a certain percentage of the fair market value that is determined by local assessors to be the total taxable value of land and additions on the property. | Land | Improvement |
|---|---|---|---|---|
| 2025 | $7,034 | $37,123 | $9,961 | $27,162 |
| 2024 | $7,034 | $35,023 | $9,453 | $25,570 |
| 2023 | $6,637 | $33,043 | $8,418 | $24,625 |
| 2022 | $6,218 | $44,520 | $13,620 | $30,900 |
| 2021 | $6,619 | $44,880 | $13,620 | $31,260 |
| 2020 | $6,548 | $39,360 | $13,620 | $25,740 |
| 2019 | $6,105 | $41,760 | $13,620 | $28,140 |
| 2018 | $5,613 | $27,536 | $10,332 | $17,204 |
| 2017 | $5,579 | $27,370 | $11,879 | $15,491 |
| 2016 | $5,239 | $27,370 | $11,879 | $15,491 |
| 2015 | $3,114 | $25,780 | $12,664 | $13,116 |
| 2014 | $3,114 | $24,322 | $12,796 | $11,526 |
Source: Public Records
Map
Nearby Homes