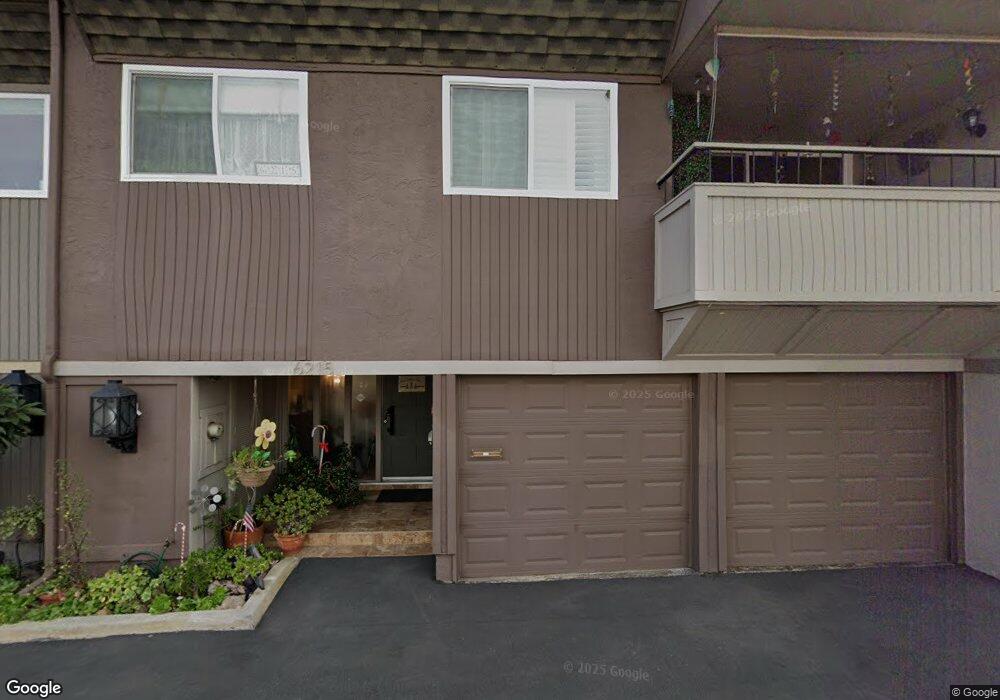
6215 Caminito Salado San Diego, CA 92111
Morena NeighborhoodEstimated Value: $708,000 - $759,000
3
Beds
2
Baths
1,392
Sq Ft
$524/Sq Ft
Est. Value
About This Home
This home is located at 6215 Caminito Salado, San Diego, CA 92111 and is currently estimated at $729,366, approximately $523 per square foot. 6215 Caminito Salado is a home located in San Diego County with nearby schools including Carson Elementary School, Montgomery Middle School, and Empower Language Academy.
Ownership History
Date
Name
Owned For
Owner Type
Purchase Details
Closed on
Jun 10, 2016
Sold by
Lopez Betty Jo and Lopez Amando Jo
Bought by
Lopez Betty Jo and Lopez Amanda Jo
Current Estimated Value
Purchase Details
Closed on
Feb 22, 1999
Sold by
Lopez Betty J and Laform Armando
Bought by
Lopez Armando Laform and Lopez Betty Jo O
Purchase Details
Closed on
Dec 22, 1998
Sold by
Lopez Betty J and Laform Armando
Bought by
Lopez Armando L and Lopez Betty J
Home Financials for this Owner
Home Financials are based on the most recent Mortgage that was taken out on this home.
Original Mortgage
$68,000
Outstanding Balance
$15,499
Interest Rate
6.82%
Estimated Equity
$713,867
Purchase Details
Closed on
Oct 21, 1998
Sold by
Lopez Betty J and Lopez Amanda J
Bought by
Lopez Armando Laform and Lopez Betty Jo
Purchase Details
Closed on
May 5, 1994
Sold by
Lopez Armando Laform and Lopez Betty Jo
Bought by
Lopez Betty Jo and Lopez Amanda Jo
Create a Home Valuation Report for This Property
The Home Valuation Report is an in-depth analysis detailing your home's value as well as a comparison with similar homes in the area
Home Values in the Area
Average Home Value in this Area
Purchase History
| Date | Buyer | Sale Price | Title Company |
|---|---|---|---|
| Lopez Betty Jo | -- | None Available | |
| Lopez Armando Laform | -- | -- | |
| Lopez Armando L | -- | New Century Title Company | |
| Lopez Armando Laform | -- | New Century Title Company | |
| Lopez Betty Jo | -- | -- |
Source: Public Records
Mortgage History
| Date | Status | Borrower | Loan Amount |
|---|---|---|---|
| Open | Lopez Armando L | $68,000 |
Source: Public Records
Tax History Compared to Growth
Tax History
| Year | Tax Paid | Tax Assessment Tax Assessment Total Assessment is a certain percentage of the fair market value that is determined by local assessors to be the total taxable value of land and additions on the property. | Land | Improvement |
|---|---|---|---|---|
| 2025 | $859 | $74,788 | $26,996 | $47,792 |
| 2024 | $859 | $73,322 | $26,467 | $46,855 |
| 2023 | $838 | $71,886 | $25,949 | $45,937 |
| 2022 | $814 | $70,478 | $25,441 | $45,037 |
| 2021 | $806 | $69,097 | $24,943 | $44,154 |
| 2020 | $794 | $68,390 | $24,688 | $43,702 |
| 2019 | $778 | $67,050 | $24,204 | $42,846 |
| 2018 | $728 | $65,736 | $23,730 | $42,006 |
| 2017 | $709 | $64,448 | $23,265 | $41,183 |
| 2016 | $694 | $63,185 | $22,809 | $40,376 |
| 2015 | $683 | $62,237 | $22,467 | $39,770 |
| 2014 | $672 | $61,018 | $22,027 | $38,991 |
Source: Public Records
Map
Nearby Homes
- 6206 Caminito Salado
- 6226 Caminito Andreta
- 6309 Caminito Salado
- 6332 Caminito Telmo
- 6273 Caminito Juanico
- 6028 Gaines St
- 6038 Cirrus St
- 6055 Cirrus St
- 5983 Gaines St
- 6202 Friars Rd Unit 215
- 6314 Friars Rd Unit 102
- 6314 Friars Rd Unit 109
- 6304 Friars Rd Unit 242
- 6202 Friars Rd Unit 306
- 6416 Friars Rd Unit 101
- 6406 Friars Rd Unit 133
- 6304 Friars Rd Unit 234
- 5725 Linda Vista Rd Unit 4
- 5747 Lauretta St
- 5727 Lauretta St
- 6219 Caminito Salado
- 6211 Caminito Salado
- 6221 Caminito Salado
- 6207 Caminito Salado
- 6214 Caminito Salado
- 6224 Caminito Luisito
- 6230 Caminito Luisito
- 6218 Caminito Luisito
- 6210 Caminito Salado
- 6218 Caminito Salado
- 6220 Caminito Salado
- 6236 Caminito Luisito
- 6227 Caminito Salado
- 6212 Caminito Luisito
- 6206 Caminito Luisito
- 6242 Caminito Luisito
- 6233 Caminito Salado
- 6248 Caminito Luisito
- 6224 Caminito Salado
- 6228 Caminito Salado