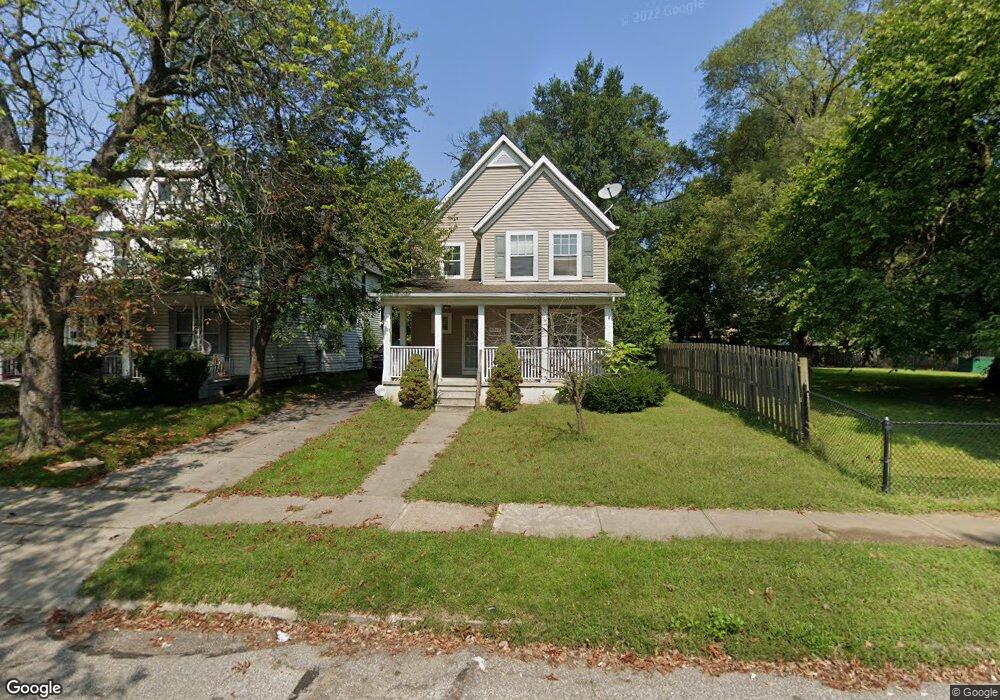
6215 Linwood Ave Cleveland, OH 44103
Hough NeighborhoodEstimated Value: $123,000 - $246,000
3
Beds
2
Baths
1,464
Sq Ft
$119/Sq Ft
Est. Value
About This Home
This home is located at 6215 Linwood Ave, Cleveland, OH 44103 and is currently estimated at $174,644, approximately $119 per square foot. 6215 Linwood Ave is a home with nearby schools including Anton Grdina School, Bolton, and Andrew J. Rickoff School.
Ownership History
Date
Name
Owned For
Owner Type
Purchase Details
Closed on
Dec 17, 2004
Sold by
Noah Ii Llc
Bought by
Parks Teresita
Current Estimated Value
Home Financials for this Owner
Home Financials are based on the most recent Mortgage that was taken out on this home.
Original Mortgage
$124,900
Outstanding Balance
$62,717
Interest Rate
5.77%
Mortgage Type
Purchase Money Mortgage
Estimated Equity
$111,927
Purchase Details
Closed on
Oct 11, 2004
Sold by
Cleveland Housing Network Inc
Bought by
Noah Ii Llc
Purchase Details
Closed on
Mar 20, 2003
Sold by
Herring Pearl and Abernathy Abernathy
Bought by
Cleveland Housing Network Inc
Purchase Details
Closed on
Mar 29, 1983
Bought by
Herring Pearl
Purchase Details
Closed on
Dec 31, 1980
Sold by
Mccreary Carey
Bought by
Church New Mt Zion Bapt
Purchase Details
Closed on
Feb 10, 1978
Sold by
Figowitz Philip and Figowitz Celia
Bought by
Mccreary Carey
Purchase Details
Closed on
Jan 1, 1975
Bought by
Figowitz Philip and Figowitz Celia
Create a Home Valuation Report for This Property
The Home Valuation Report is an in-depth analysis detailing your home's value as well as a comparison with similar homes in the area
Home Values in the Area
Average Home Value in this Area
Purchase History
| Date | Buyer | Sale Price | Title Company |
|---|---|---|---|
| Parks Teresita | $155,900 | Equity Title Agency | |
| Noah Ii Llc | -- | Equity Title Agency | |
| Cleveland Housing Network Inc | $1,595 | Equity Title Agency Inc | |
| Herring Pearl | $6,000 | -- | |
| Church New Mt Zion Bapt | -- | -- | |
| Mccreary Carey | $7,000 | -- | |
| Figowitz Philip | -- | -- |
Source: Public Records
Mortgage History
| Date | Status | Borrower | Loan Amount |
|---|---|---|---|
| Open | Parks Teresita | $124,900 | |
| Closed | Parks Teresita | $30,000 |
Source: Public Records
Tax History Compared to Growth
Tax History
| Year | Tax Paid | Tax Assessment Tax Assessment Total Assessment is a certain percentage of the fair market value that is determined by local assessors to be the total taxable value of land and additions on the property. | Land | Improvement |
|---|---|---|---|---|
| 2024 | $4,332 | $64,785 | $3,815 | $60,970 |
| 2023 | $3,519 | $45,400 | $2,100 | $43,300 |
| 2022 | $3,500 | $45,400 | $2,100 | $43,300 |
| 2021 | $3,467 | $45,400 | $2,100 | $43,300 |
| 2020 | $3,456 | $39,130 | $1,820 | $37,310 |
| 2019 | $149 | $5,200 | $5,200 | $0 |
| 2018 | $170 | $1,820 | $1,820 | $0 |
| 2017 | $193 | $2,280 | $2,280 | $0 |
| 2016 | $191 | $2,280 | $2,280 | $0 |
| 2015 | $183 | $2,280 | $2,280 | $0 |
| 2014 | $183 | $2,170 | $2,170 | $0 |
Source: Public Records
Map
Nearby Homes
- 1485 E 65th St
- 1493 E 65th St
- 1489 E 65th St
- 6316 Lexington Ave
- 6004 Lexington Ave
- 0 White Ave Unit 5144301
- 5708 Quimby Ave
- 1377 E 66th St
- 1713 E 69th Place
- 6700 Whitney Ave
- 5009 Harlem Ct
- 6407 Dibble Ave
- 7106 Lawnview Ave
- 1615 E 47th St
- 6004 Superior Ave
- 6711 Lucerne Ave
- 2211 E 71st St
- 7307 Linwood Ave
- 7212 Wade Park Ave Unit 4
- 1270 E 58th St
- 6211 Linwood Ave
- 6115 Linwood Ave
- 6202 Whittier Ave
- 6220 Linwood Ave
- 6300 Linwood Ave
- 6210 Whittier Ave
- 6208 Linwood Ave
- 6111 Linwood Ave
- 6304 Whittier Ave
- 6100 Whittier Ave
- 6204 Linwood Ave
- 6400 Whittier Ave
- 6400 Whittier Ave
- 6004 Whittier Ave
- 6110 Linwood Ave
- 6106 Linwood Ave
- 6404 Whittier Ave
- 6404 Whittier Ave
- 5908 Whittier Ave
- 6102 Linwood Ave