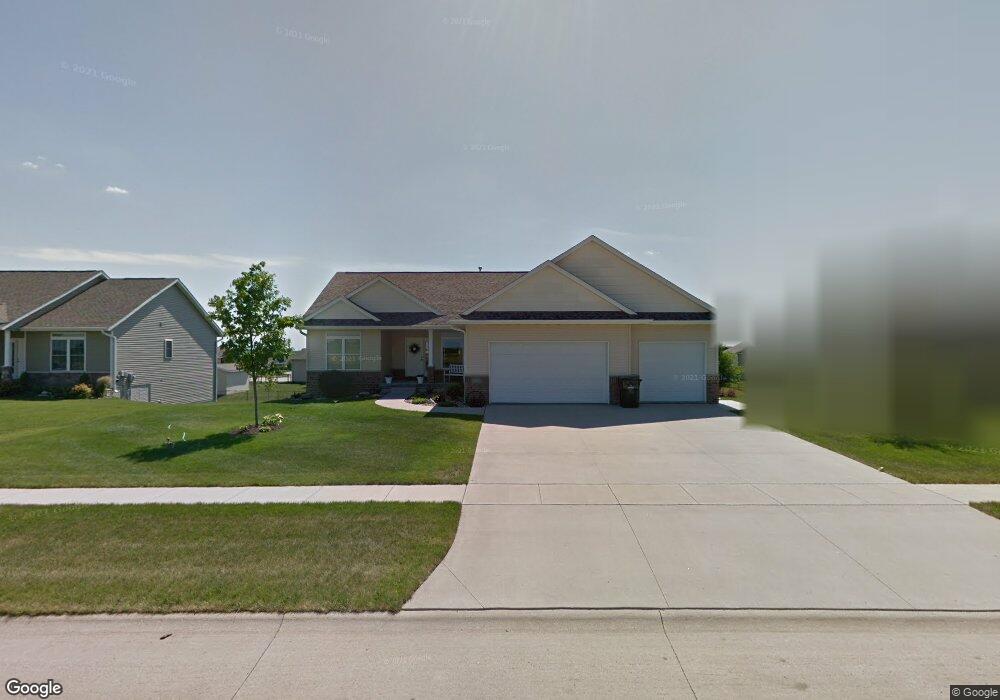
6218 Hoover Trail Rd SW Cedar Rapids, IA 52404
Estimated Value: $284,000 - $407,000
4
Beds
4
Baths
1,570
Sq Ft
$236/Sq Ft
Est. Value
About This Home
This home is located at 6218 Hoover Trail Rd SW, Cedar Rapids, IA 52404 and is currently estimated at $370,815, approximately $236 per square foot. 6218 Hoover Trail Rd SW is a home located in Linn County with nearby schools including Prairie Heights Elementary School, Prairie Crest Elementary School, and Prairie View Elementary School.
Ownership History
Date
Name
Owned For
Owner Type
Purchase Details
Closed on
Aug 16, 2016
Sold by
Schnoor Jed D and Schnoor Allison L
Bought by
Lamb Patrick L and Lamb Tracy A
Current Estimated Value
Purchase Details
Closed on
Aug 31, 2007
Sold by
Arch Custom Homes
Bought by
Schnoor Jed D and Schnoor Allison L
Home Financials for this Owner
Home Financials are based on the most recent Mortgage that was taken out on this home.
Original Mortgage
$189,600
Interest Rate
6.72%
Mortgage Type
Purchase Money Mortgage
Purchase Details
Closed on
Apr 13, 2007
Sold by
Sevig Development Lc
Bought by
Arch Custom Homes Inc
Home Financials for this Owner
Home Financials are based on the most recent Mortgage that was taken out on this home.
Original Mortgage
$188,250
Interest Rate
6.2%
Mortgage Type
Construction
Create a Home Valuation Report for This Property
The Home Valuation Report is an in-depth analysis detailing your home's value as well as a comparison with similar homes in the area
Home Values in the Area
Average Home Value in this Area
Purchase History
| Date | Buyer | Sale Price | Title Company |
|---|---|---|---|
| Lamb Patrick L | -- | None Available | |
| Lamb Patrick W | -- | None Available | |
| Schnoor Jed D | $237,000 | None Available | |
| Arch Custom Homes Inc | $44,500 | None Available |
Source: Public Records
Mortgage History
| Date | Status | Borrower | Loan Amount |
|---|---|---|---|
| Previous Owner | Schnoor Jed D | $189,600 | |
| Previous Owner | Arch Custom Homes Inc | $188,250 |
Source: Public Records
Tax History Compared to Growth
Tax History
| Year | Tax Paid | Tax Assessment Tax Assessment Total Assessment is a certain percentage of the fair market value that is determined by local assessors to be the total taxable value of land and additions on the property. | Land | Improvement |
|---|---|---|---|---|
| 2025 | $6,776 | $393,800 | $78,400 | $315,400 |
| 2024 | $6,482 | $385,700 | $78,400 | $307,300 |
| 2023 | $6,482 | $368,000 | $78,400 | $289,600 |
| 2022 | $6,202 | $301,500 | $71,300 | $230,200 |
| 2021 | $6,304 | $294,300 | $64,100 | $230,200 |
| 2020 | $6,304 | $285,500 | $59,400 | $226,100 |
| 2019 | $5,878 | $270,600 | $52,300 | $218,300 |
| 2018 | $4,762 | $270,600 | $52,300 | $218,300 |
| 2017 | $4,982 | $229,900 | $52,300 | $177,600 |
| 2016 | $5,123 | $236,700 | $52,300 | $184,400 |
| 2015 | $4,934 | $244,056 | $52,250 | $191,806 |
| 2014 | $5,064 | $244,056 | $52,250 | $191,806 |
| 2013 | $4,810 | $244,056 | $52,250 | $191,806 |
Source: Public Records
Map
Nearby Homes
- 1410 Scarlet Sage Dr SW
- 5810 Bethpage Cir SW
- 6614 Scarlet Rose Cir SW
- 1719 Prairie Rose Dr SW
- 6612 Artesa Bell Dr SW
- 7113 Chenango Ln SW
- 6812 Artesa Bell Dr SW
- 7006 Colpepper Dr SW
- Lot 6 College Farms 5th Addition SW
- 5112 Scenic View Ct SW
- Lot 2
- Tbd Old River Rd SW
- 4240 Briar Ridge Ct
- 51 Oklahoma Ave SW
- 5655 Deerwood St SW
- 6620 Preston Terrace Ct SW
- 3728 Sunshine St SW
- 62 Oklahoma Ave SW
- 0 41st Avenue Dr SW Unit 202507355
- 0 41st Avenue Dr SW Unit 1 Ac
- 6222 Hoover Trail Rd SW
- 6213 Fillmore Ct SW
- 6219 Fillmore Ct SW
- 6215 Hoover Trail Rd SW
- 6207 Fillmore Ct SW
- 6221 Hoover Trail Rd SW
- 6225 Fillmore Ct SW
- 6230 Hoover Trail Rd SW
- 6204 Hoover Trail Rd SW
- 6227 Hoover Trail Rd SW
- 6209 Hoover Trail Rd SW
- 6201 Fillmore Ct SW
- 6302 Hoover Trail Rd SW
- 6203 Hoover Trail Rd SW
- 6303 Fillmore Ct SW
- 6212 Fillmore Ct SW
- 6218 Fillmore Ct SW
- 6208 Fillmore Ct SW
- 6202 Fillmore Ct SW
- 1503 Hoover Trail Cir SW