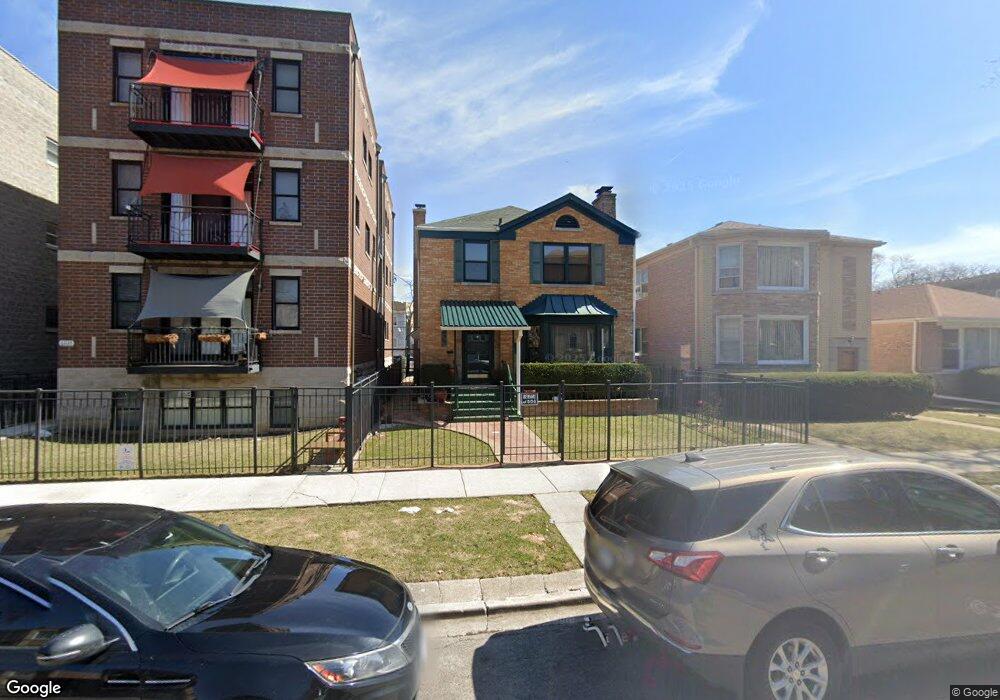
6219 N Richmond St Chicago, IL 60659
West Ridge NeighborhoodEstimated Value: $482,392 - $509,000
5
Beds
3
Baths
1,759
Sq Ft
$285/Sq Ft
Est. Value
About This Home
This home is located at 6219 N Richmond St, Chicago, IL 60659 and is currently estimated at $500,848, approximately $284 per square foot. 6219 N Richmond St is a home located in Cook County with nearby schools including West Ridge Elementary School, Mather High School, and Passages Elementary Charter School.
Ownership History
Date
Name
Owned For
Owner Type
Purchase Details
Closed on
Apr 10, 2001
Sold by
Joseph Thomas H
Bought by
Staneva Ilian
Current Estimated Value
Home Financials for this Owner
Home Financials are based on the most recent Mortgage that was taken out on this home.
Original Mortgage
$249,850
Outstanding Balance
$92,310
Interest Rate
7.05%
Estimated Equity
$408,538
Purchase Details
Closed on
Mar 17, 2000
Sold by
Joseph Alice
Bought by
Joseph Thomas H and Alice Joseph Land Trust
Purchase Details
Closed on
Jul 16, 1999
Sold by
Elkayam Joseph
Bought by
Elkayam Joseph and Elkayam Elizabeth
Home Financials for this Owner
Home Financials are based on the most recent Mortgage that was taken out on this home.
Original Mortgage
$300,000
Interest Rate
8%
Create a Home Valuation Report for This Property
The Home Valuation Report is an in-depth analysis detailing your home's value as well as a comparison with similar homes in the area
Home Values in the Area
Average Home Value in this Area
Purchase History
| Date | Buyer | Sale Price | Title Company |
|---|---|---|---|
| Staneva Ilian | $263,000 | -- | |
| Joseph Thomas H | -- | -- | |
| Elkayam Joseph | -- | -- |
Source: Public Records
Mortgage History
| Date | Status | Borrower | Loan Amount |
|---|---|---|---|
| Open | Staneva Ilian | $249,850 | |
| Previous Owner | Elkayam Joseph | $300,000 |
Source: Public Records
Tax History Compared to Growth
Tax History
| Year | Tax Paid | Tax Assessment Tax Assessment Total Assessment is a certain percentage of the fair market value that is determined by local assessors to be the total taxable value of land and additions on the property. | Land | Improvement |
|---|---|---|---|---|
| 2024 | $6,552 | $41,824 | $15,140 | $26,684 |
| 2023 | $7,525 | $34,369 | $12,276 | $22,093 |
| 2022 | $7,525 | $40,000 | $12,276 | $27,724 |
| 2021 | $7,375 | $40,004 | $12,280 | $27,724 |
| 2020 | $5,793 | $29,106 | $7,365 | $21,741 |
| 2019 | $6,350 | $35,034 | $7,365 | $27,669 |
| 2018 | $6,242 | $35,034 | $7,365 | $27,669 |
| 2017 | $6,456 | $33,367 | $6,547 | $26,820 |
| 2016 | $6,183 | $33,367 | $6,547 | $26,820 |
| 2015 | $5,634 | $33,367 | $6,547 | $26,820 |
| 2014 | $5,048 | $29,776 | $6,138 | $23,638 |
| 2013 | $4,937 | $29,776 | $6,138 | $23,638 |
Source: Public Records
Map
Nearby Homes
- 6226 N Mozart St Unit 2N
- 6214 N Mozart St Unit 3E
- 6212 N Sacramento Ave
- 6235 N Mozart St
- 6210 N Albany Ave
- 6400 N Sacramento Ave Unit 205
- 6312 N Fairfield Ave Unit 3B
- 6310 N Troy St
- 6215 N Washtenaw Ave
- 6508 N Richmond St Unit 1D
- 6451 N California Ave Unit 2
- 6040 N Troy St Unit 306
- 6457 N California Ave Unit 3
- 6504 N Whipple St
- 6215 N Talman Ave
- 6308 N Kedzie Ave Unit 2W
- 6307 N Talman Ave
- 6539 N Sacramento Ave
- 6414 N Rockwell St
- 6418 N Rockwell St
- 6225 N Richmond St Unit 2E
- 6225 N Richmond St Unit 1E
- 6225 N Richmond St Unit 1W
- 6225 N Richmond St Unit 2W
- 6217 N Richmond St
- 6213 N Richmond St
- 6229 N Richmond St Unit 4S
- 6229 N Richmond St Unit 4N
- 6229 N Richmond St Unit 3S
- 6229 N Richmond St Unit 3N
- 6229 N Richmond St Unit 2S
- 6229 N Richmond St Unit 2N
- 6229 N Richmond St Unit 1S
- 6229 N Richmond St Unit 1N
- 6229 N Richmond St
- 6229 N Richmond St Unit 3B
- 6229 N Richmond St Unit 3A
- 6229 N Richmond St Unit 2B
- 6229 N Richmond St Unit 2A
- 6229 N Richmond St Unit 1D