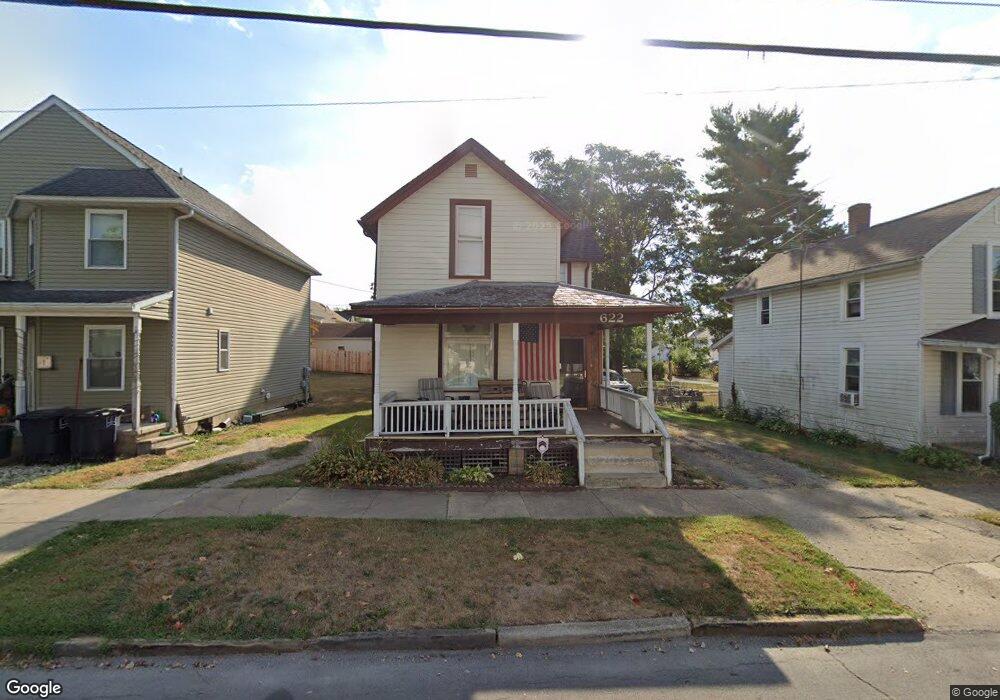
622 N Maple St Lancaster, OH 43130
Estimated Value: $203,000 - $220,000
3
Beds
1
Bath
1,481
Sq Ft
$143/Sq Ft
Est. Value
About This Home
This home is located at 622 N Maple St, Lancaster, OH 43130 and is currently estimated at $211,233, approximately $142 per square foot. 622 N Maple St is a home located in Fairfield County with nearby schools including Thomas Ewing Junior High School, Lancaster High School, and St Mary Elementary School.
Ownership History
Date
Name
Owned For
Owner Type
Purchase Details
Closed on
Dec 8, 2000
Sold by
Est Esther M Adkins
Bought by
Patton Stephen P and Patton Linda S
Current Estimated Value
Home Financials for this Owner
Home Financials are based on the most recent Mortgage that was taken out on this home.
Original Mortgage
$58,700
Interest Rate
7.7%
Mortgage Type
New Conventional
Purchase Details
Closed on
Apr 28, 1992
Sold by
Adkins George W
Bought by
Adkins George W
Create a Home Valuation Report for This Property
The Home Valuation Report is an in-depth analysis detailing your home's value as well as a comparison with similar homes in the area
Home Values in the Area
Average Home Value in this Area
Purchase History
| Date | Buyer | Sale Price | Title Company |
|---|---|---|---|
| Patton Stephen P | $61,800 | -- | |
| Adkins George W | -- | -- |
Source: Public Records
Mortgage History
| Date | Status | Borrower | Loan Amount |
|---|---|---|---|
| Previous Owner | Patton Stephen P | $58,700 |
Source: Public Records
Tax History Compared to Growth
Tax History
| Year | Tax Paid | Tax Assessment Tax Assessment Total Assessment is a certain percentage of the fair market value that is determined by local assessors to be the total taxable value of land and additions on the property. | Land | Improvement |
|---|---|---|---|---|
| 2024 | $4,404 | $48,990 | $7,630 | $41,360 |
| 2023 | $1,820 | $48,990 | $7,630 | $41,360 |
| 2022 | $1,789 | $48,990 | $7,630 | $41,360 |
| 2021 | $1,524 | $39,100 | $7,630 | $31,470 |
| 2020 | $1,460 | $39,100 | $7,630 | $31,470 |
| 2019 | $1,388 | $39,100 | $7,630 | $31,470 |
| 2018 | $1,096 | $29,550 | $7,630 | $21,920 |
| 2017 | $1,097 | $29,320 | $7,350 | $21,970 |
| 2016 | $1,068 | $29,320 | $7,350 | $21,970 |
| 2015 | $1,064 | $28,350 | $7,350 | $21,000 |
| 2014 | $1,014 | $28,350 | $7,350 | $21,000 |
| 2013 | $1,014 | $28,350 | $7,350 | $21,000 |
Source: Public Records
Map
Nearby Homes
- 521 E Allen St
- 538 E 6th Ave
- 404 E 6th Ave
- 311 E Allen St
- 230 Lake St
- 708 N High St
- 220 E Fair Ave
- 806 N High St
- 700 E Allen St
- 608 E Mulberry St
- 800 Rutter Ave
- 632 N Eastwood Ave
- 0 N High St
- 629 E Wheeling St
- 153 King St
- 534 E Wheeling St
- 545 E Main St
- 405 N Broad St
- 571 E Chestnut St
- 831 Franklin Ave